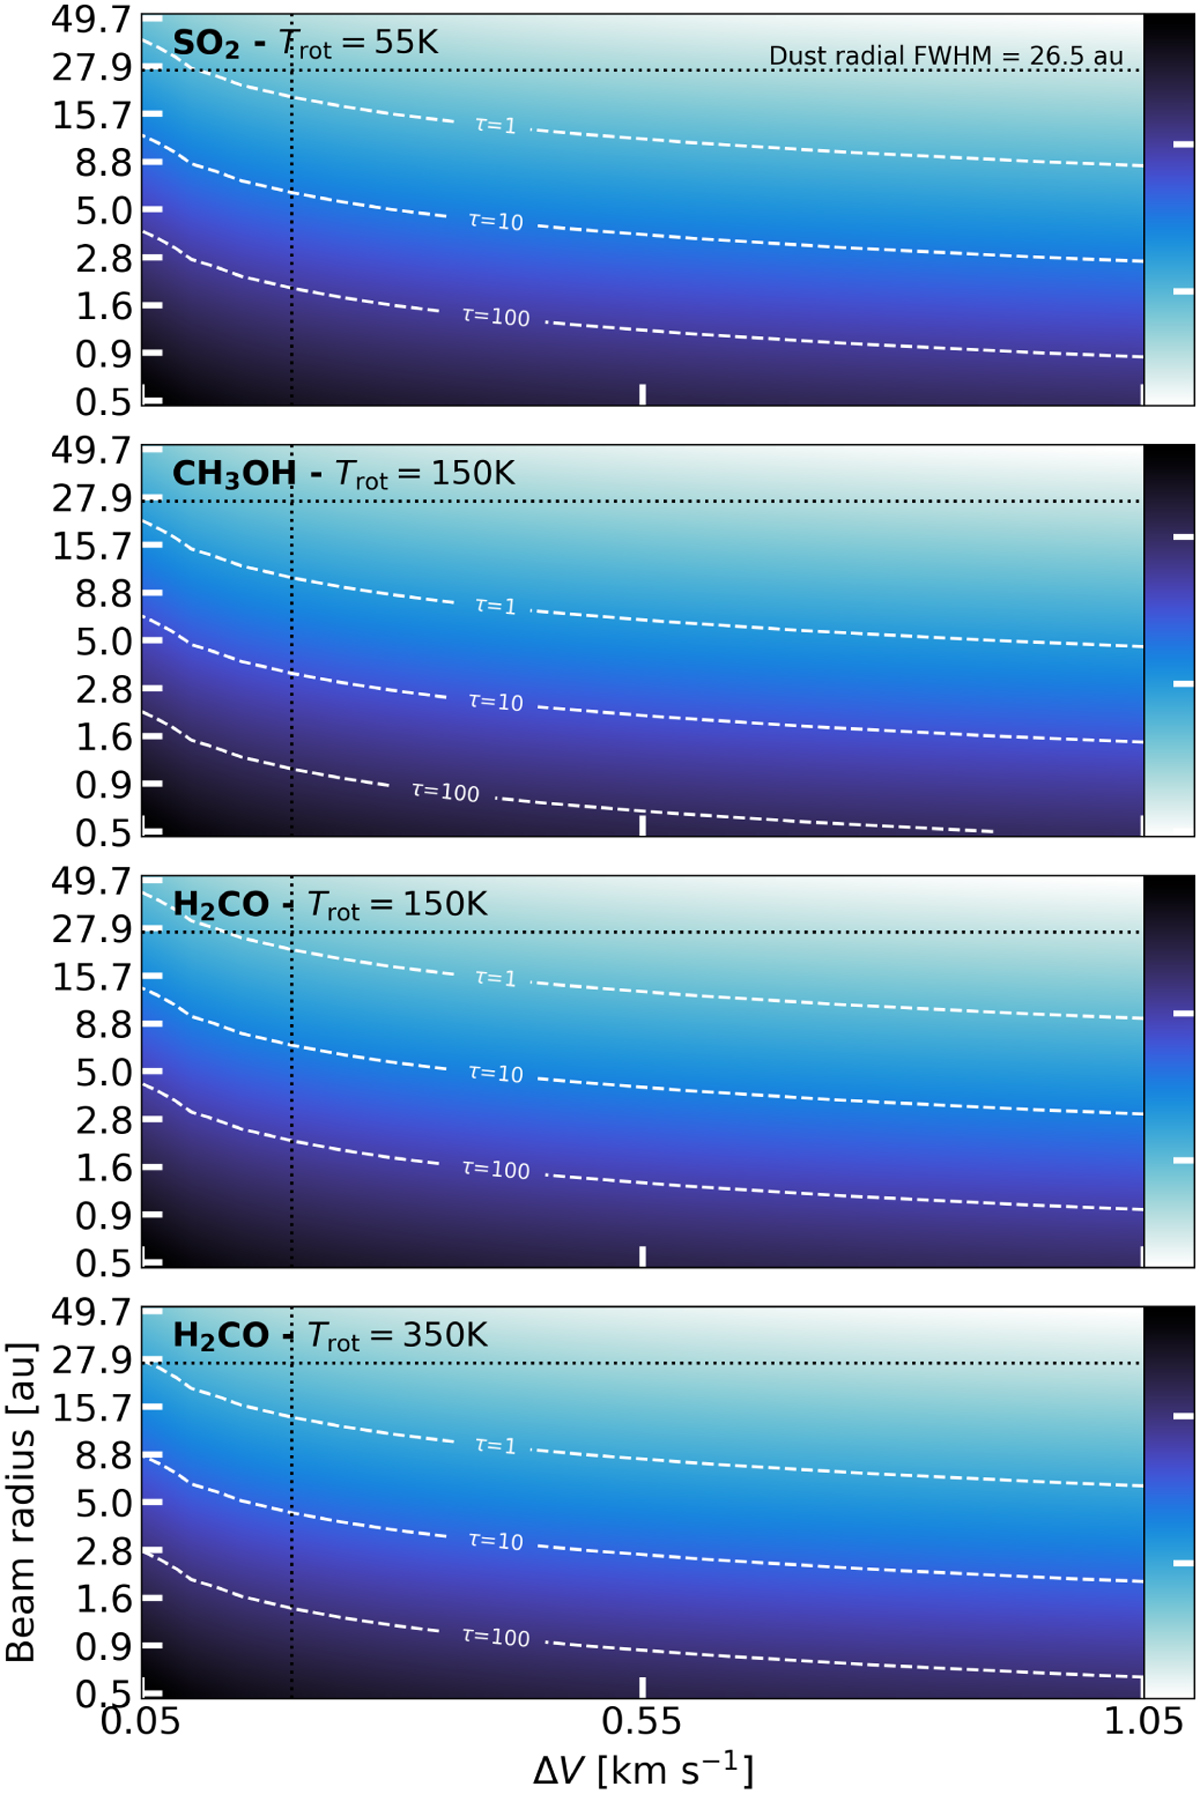
Fig. 8
Download original image
Optical depth (given in log10-space) grids for a range of beam radii (assuming circular beams) and turbulent line widths (∆V) for SO2 J=64,2−63,3 (at Trot=55 K), CH3OH 7=13−1−130 (at Trot=150 K, accounting for the underestimation of the temperature due to sub-thermal excitation), and H2CO J=51,5−41,4 (at Trot=150 K and Trot=350 K). The contour lines indicate values of τ=1, 10, and 100. The dotted black line indicates the radial FWHM of the dust trap (FWHMdust ≃ 26.5 au), found using the high-resolution observations of Yang et al. (2023). The vertical dashed line indicates a turbulent line width of ∆Vline=0.2 km s−1, the lower value used in our analysis.
Current usage metrics show cumulative count of Article Views (full-text article views including HTML views, PDF and ePub downloads, according to the available data) and Abstracts Views on Vision4Press platform.
Data correspond to usage on the plateform after 2015. The current usage metrics is available 48-96 hours after online publication and is updated daily on week days.
Initial download of the metrics may take a while.