Open Access
Fig. 7
Download original image
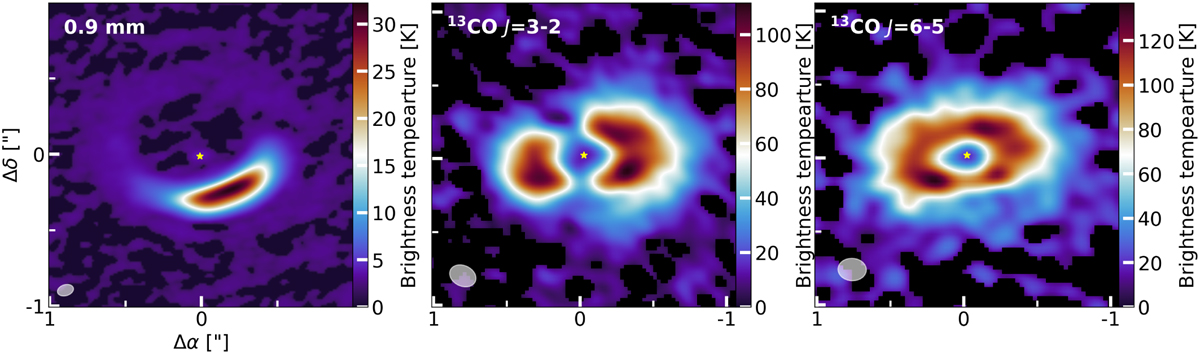
Brightness temperature maps of the dust continuum (left) and the 13CO .J=3−2 (middle panel) and 13CO .J=6−5 (right panel) transitions. The yellow stars in the centre indicate the approximate location of the host star, while the resolving beams are indicated by the white ellipses.
Current usage metrics show cumulative count of Article Views (full-text article views including HTML views, PDF and ePub downloads, according to the available data) and Abstracts Views on Vision4Press platform.
Data correspond to usage on the plateform after 2015. The current usage metrics is available 48-96 hours after online publication and is updated daily on week days.
Initial download of the metrics may take a while.