Fig. 5
Download original image
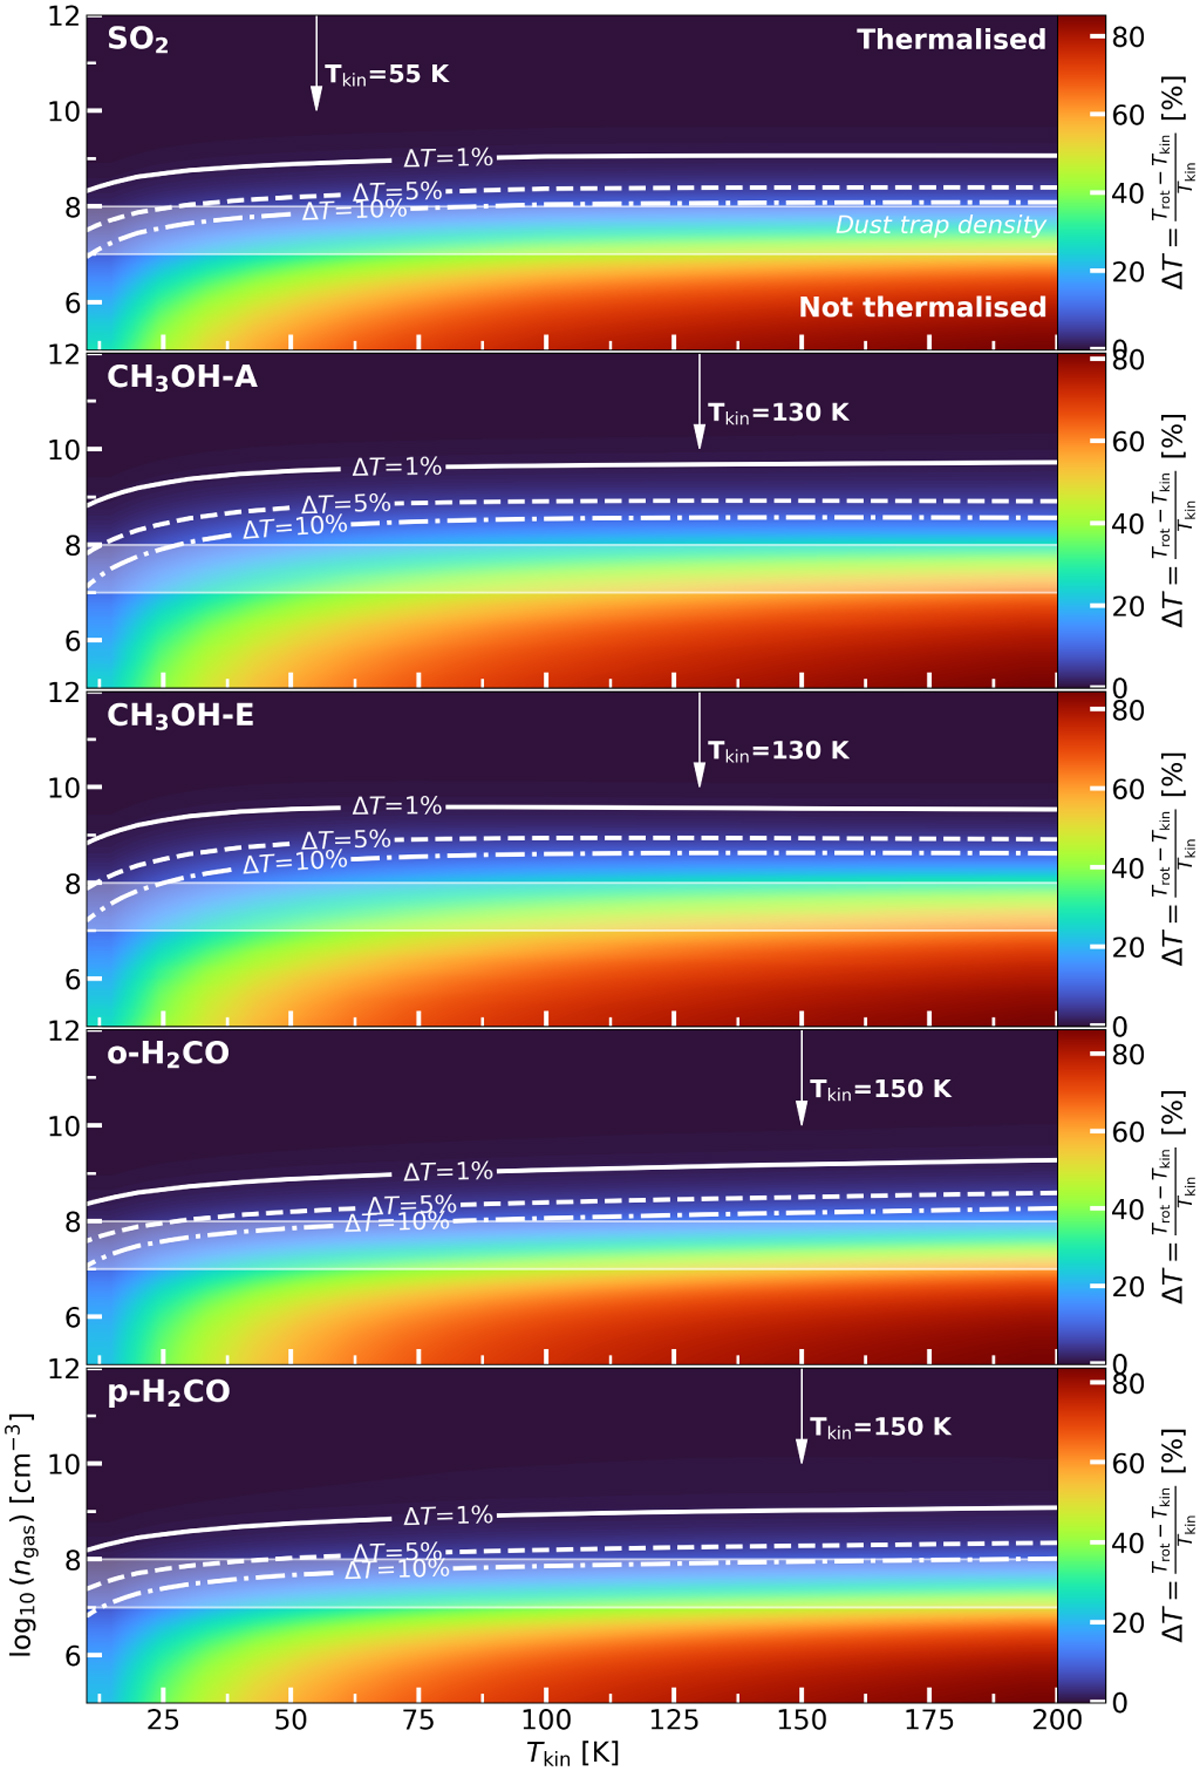
RADEX grids for SO2 (top panel), A- and E-type CH3OH (second and third panels), and ortho- and para-H2CO (bottom two panels) showing the percentile difference between the kinetic and rotational temperature (∆T), as a measure of thermalised transitions. The contours (solid, dashed, and dashed-dotted) in each panel indicates when ∆T=1%, 5%, and 10%, respectively. Above these contours the lines will be thermalised. The white shaded area indicates the gas density of the dust trap according to the DALI model (Leemker et al. 2023). Finally, the arrows indicate the derived excitation temperatures of T ~ 55 K for SO2 and T ~ 130 K for CH3OH. For H2CO we show the rotational temperature of 150 K, the lower value of the inferred temperature range.
Current usage metrics show cumulative count of Article Views (full-text article views including HTML views, PDF and ePub downloads, according to the available data) and Abstracts Views on Vision4Press platform.
Data correspond to usage on the plateform after 2015. The current usage metrics is available 48-96 hours after online publication and is updated daily on week days.
Initial download of the metrics may take a while.