Fig. 4
Download original image
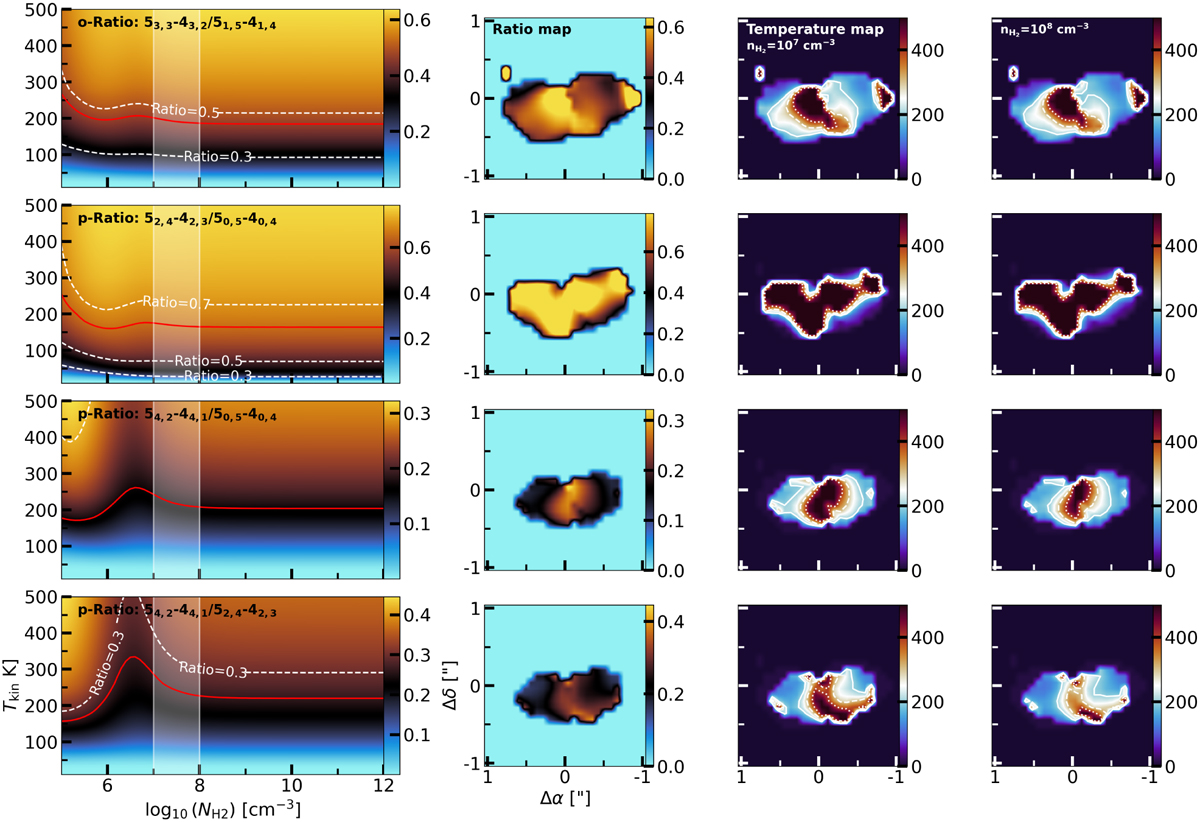
Line ratios for the different pairs of H2CO transitions. The left panels show the RADEX calculations, with the colour map indicating the various ratios. The white contours indicate the values of 0.3, 0.5, and 0.7, whereas the red contour indicates the disk integrated ratio from van der Marel et al. (2021). The panels in the second column indicate the ratios derived for the pixels where both transitions are detected, using the colour scheme as for the left panels. The final two columns display the derived temperatures for gas densities of ![]() (representative of the disk’s atmosphere, z/r ≳0.2) and 108 cm−3 (representative of the disk’s midplane). The white solid, dashed, and dotted contours indicate temperatures of 200 K, 300 K, and 400 K, respectively.
(representative of the disk’s atmosphere, z/r ≳0.2) and 108 cm−3 (representative of the disk’s midplane). The white solid, dashed, and dotted contours indicate temperatures of 200 K, 300 K, and 400 K, respectively.
Current usage metrics show cumulative count of Article Views (full-text article views including HTML views, PDF and ePub downloads, according to the available data) and Abstracts Views on Vision4Press platform.
Data correspond to usage on the plateform after 2015. The current usage metrics is available 48-96 hours after online publication and is updated daily on week days.
Initial download of the metrics may take a while.