Fig. 10
Download original image
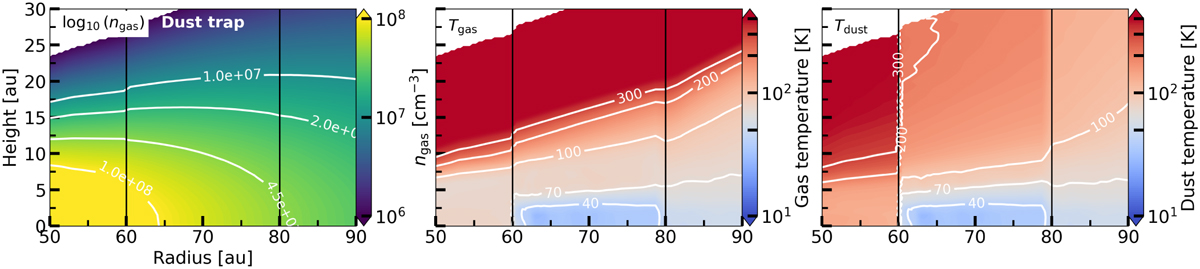
Zoom-in of the model structure of the dust trap region of the IRS 48 disk of the gas density (ngas in cm−3, left panel) and gas and dust temperature (both in Kelvin, left and right panels, respectively). The vertical bars indicate the location of the dust trap, extending from 60 to 80 au, while the white contours in the left most panel indicate gas densities between 107 and 108 cm−3. The images have been adapted from Leemker et al. (2023).
Current usage metrics show cumulative count of Article Views (full-text article views including HTML views, PDF and ePub downloads, according to the available data) and Abstracts Views on Vision4Press platform.
Data correspond to usage on the plateform after 2015. The current usage metrics is available 48-96 hours after online publication and is updated daily on week days.
Initial download of the metrics may take a while.