Fig. 1
Download original image
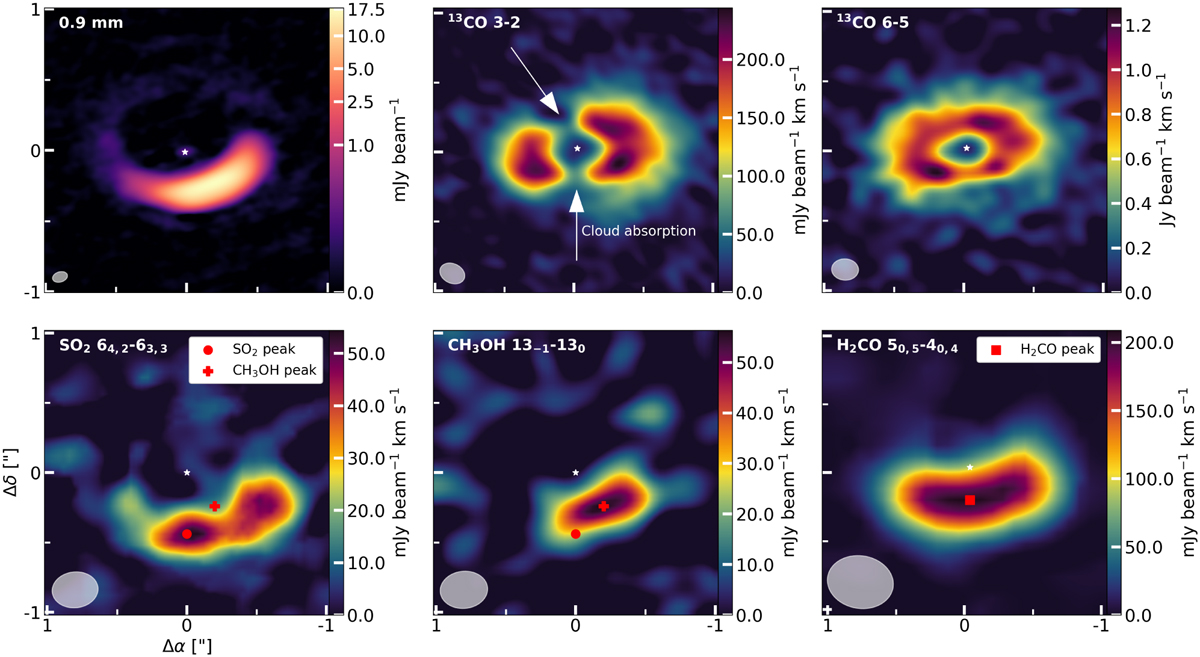
Dust continuum (top left; Yang et al. 2023) and moment-0 maps of the 13CO.J=3−2 (top centre; Leemker et al. 2023) and .J=6−5 (top right; van der Marel et al. 2016), and the SO2 J=64,2–63,3 (bottom left), CH3OH J=13−1−130 (bottom centre), and H2CO J=50,5−40,4 (bottom right) transitions. The white star in the centre indicates the approximate location of the host star, whereas the resolving beam is indicated in the lower left. The red circle and cross provide, respectively, the peak flux position of the SO2 and CH3OH transitions in the bottom left and centre plots, whereas the red square denotes the peak flux position of the H2CO transition in the bottom right plot. In addition, the arrows in the 13CO .J=3−2 transition indicate where the emission is affected by the cloud absorption.
Current usage metrics show cumulative count of Article Views (full-text article views including HTML views, PDF and ePub downloads, according to the available data) and Abstracts Views on Vision4Press platform.
Data correspond to usage on the plateform after 2015. The current usage metrics is available 48-96 hours after online publication and is updated daily on week days.
Initial download of the metrics may take a while.