Open Access
Fig. 8.
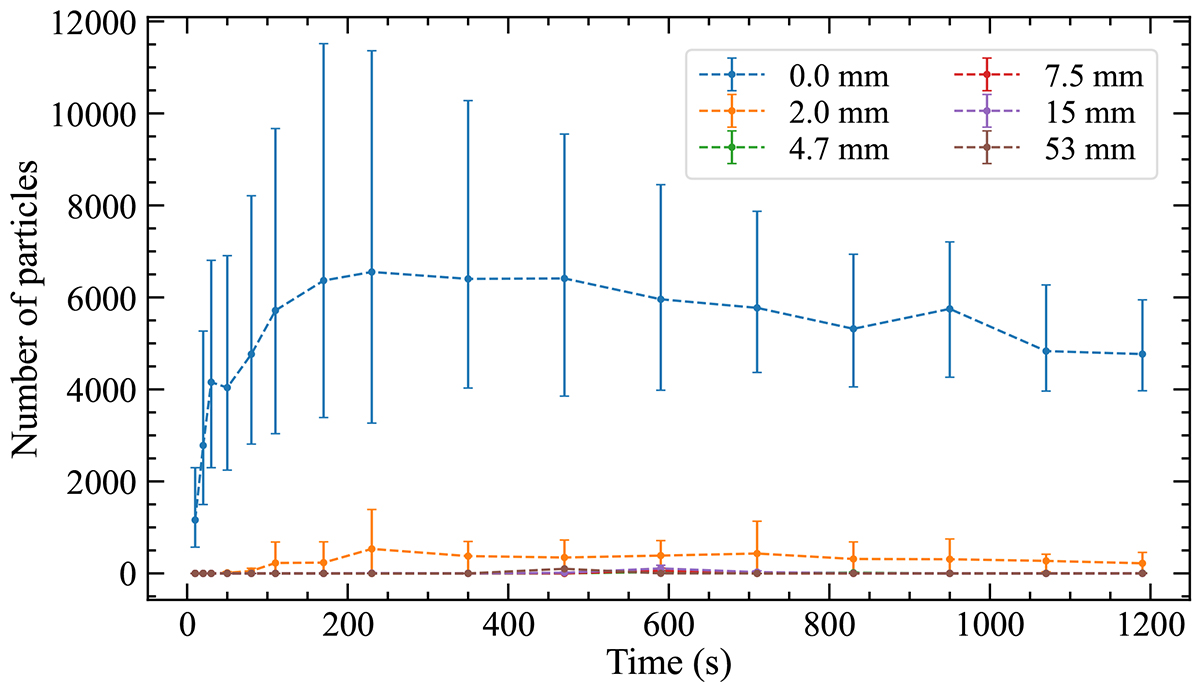
Download original image
Number of detected particles for different thicknesses of the water layer between the artificial Sun and the sample as a function of time after the start of insolation. The error bars indicate the minimal and maximal measured particle numbers in two to four experimental runs.
Current usage metrics show cumulative count of Article Views (full-text article views including HTML views, PDF and ePub downloads, according to the available data) and Abstracts Views on Vision4Press platform.
Data correspond to usage on the plateform after 2015. The current usage metrics is available 48-96 hours after online publication and is updated daily on week days.
Initial download of the metrics may take a while.