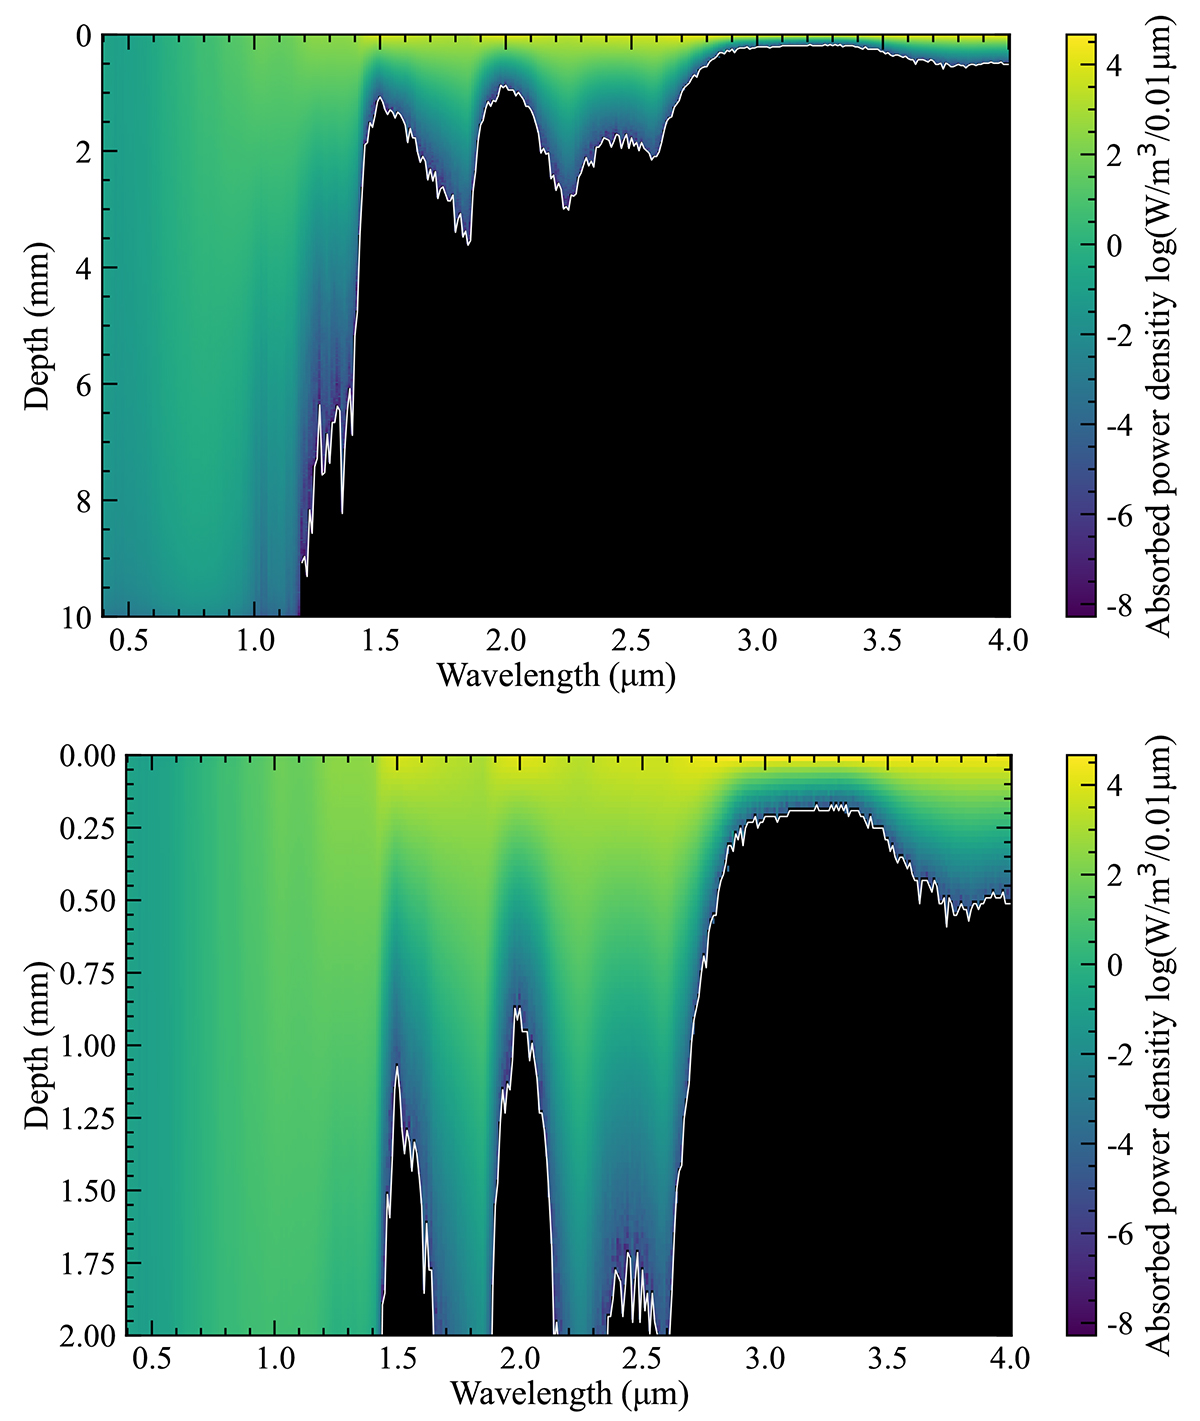
Fig. 7.
Download original image
Absorbed power density for different wavelengths in the first 10 mm (top) and 2 mm (bottom) of the sample in W/m2. The colours indicate the logarithm of the absorbed power density, while black indicates that no energy is absorbed. The white curves denote the maximum penetration depth of incoming light as a function of wavelength and have been added to guide the eye.
Current usage metrics show cumulative count of Article Views (full-text article views including HTML views, PDF and ePub downloads, according to the available data) and Abstracts Views on Vision4Press platform.
Data correspond to usage on the plateform after 2015. The current usage metrics is available 48-96 hours after online publication and is updated daily on week days.
Initial download of the metrics may take a while.