Fig. 4.
Download original image
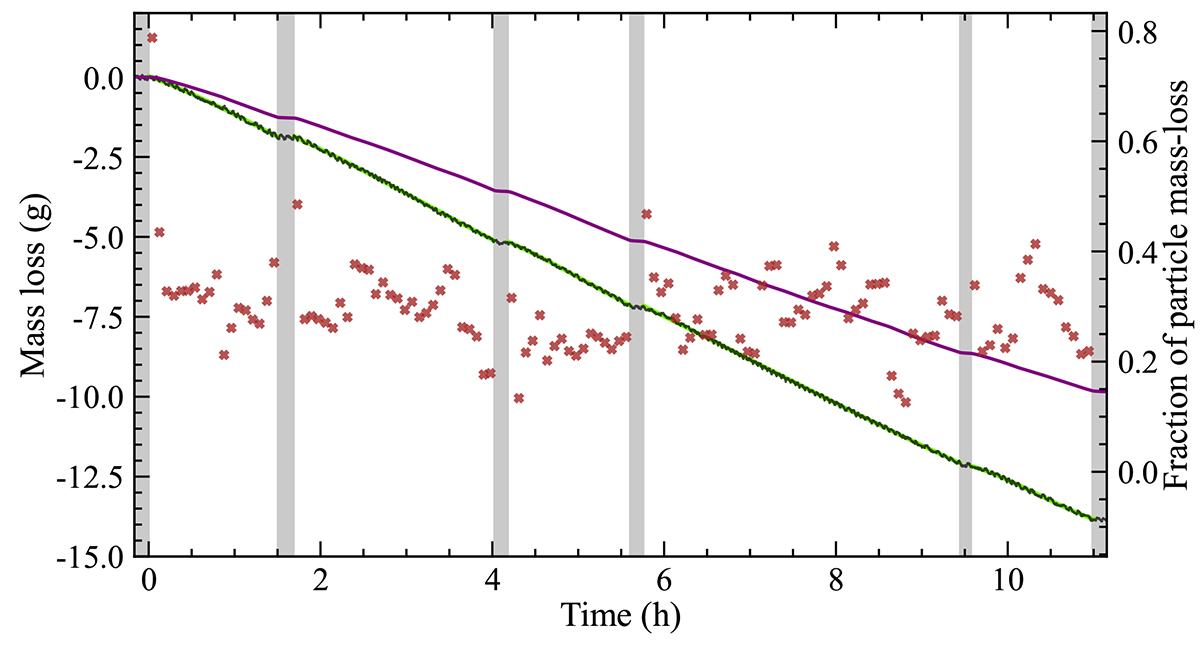
Mass loss of the sample over time measured by the scale (black) and the infrared camera (purple). The brown crosses indicate the fraction of mass loss by particles and the grey areas mark the periods when the lamp was turned off. The green curves between successive eclipses show the cubic-polynomial fit to the noisy scale measurements.
Current usage metrics show cumulative count of Article Views (full-text article views including HTML views, PDF and ePub downloads, according to the available data) and Abstracts Views on Vision4Press platform.
Data correspond to usage on the plateform after 2015. The current usage metrics is available 48-96 hours after online publication and is updated daily on week days.
Initial download of the metrics may take a while.