Fig. 10.
Download original image
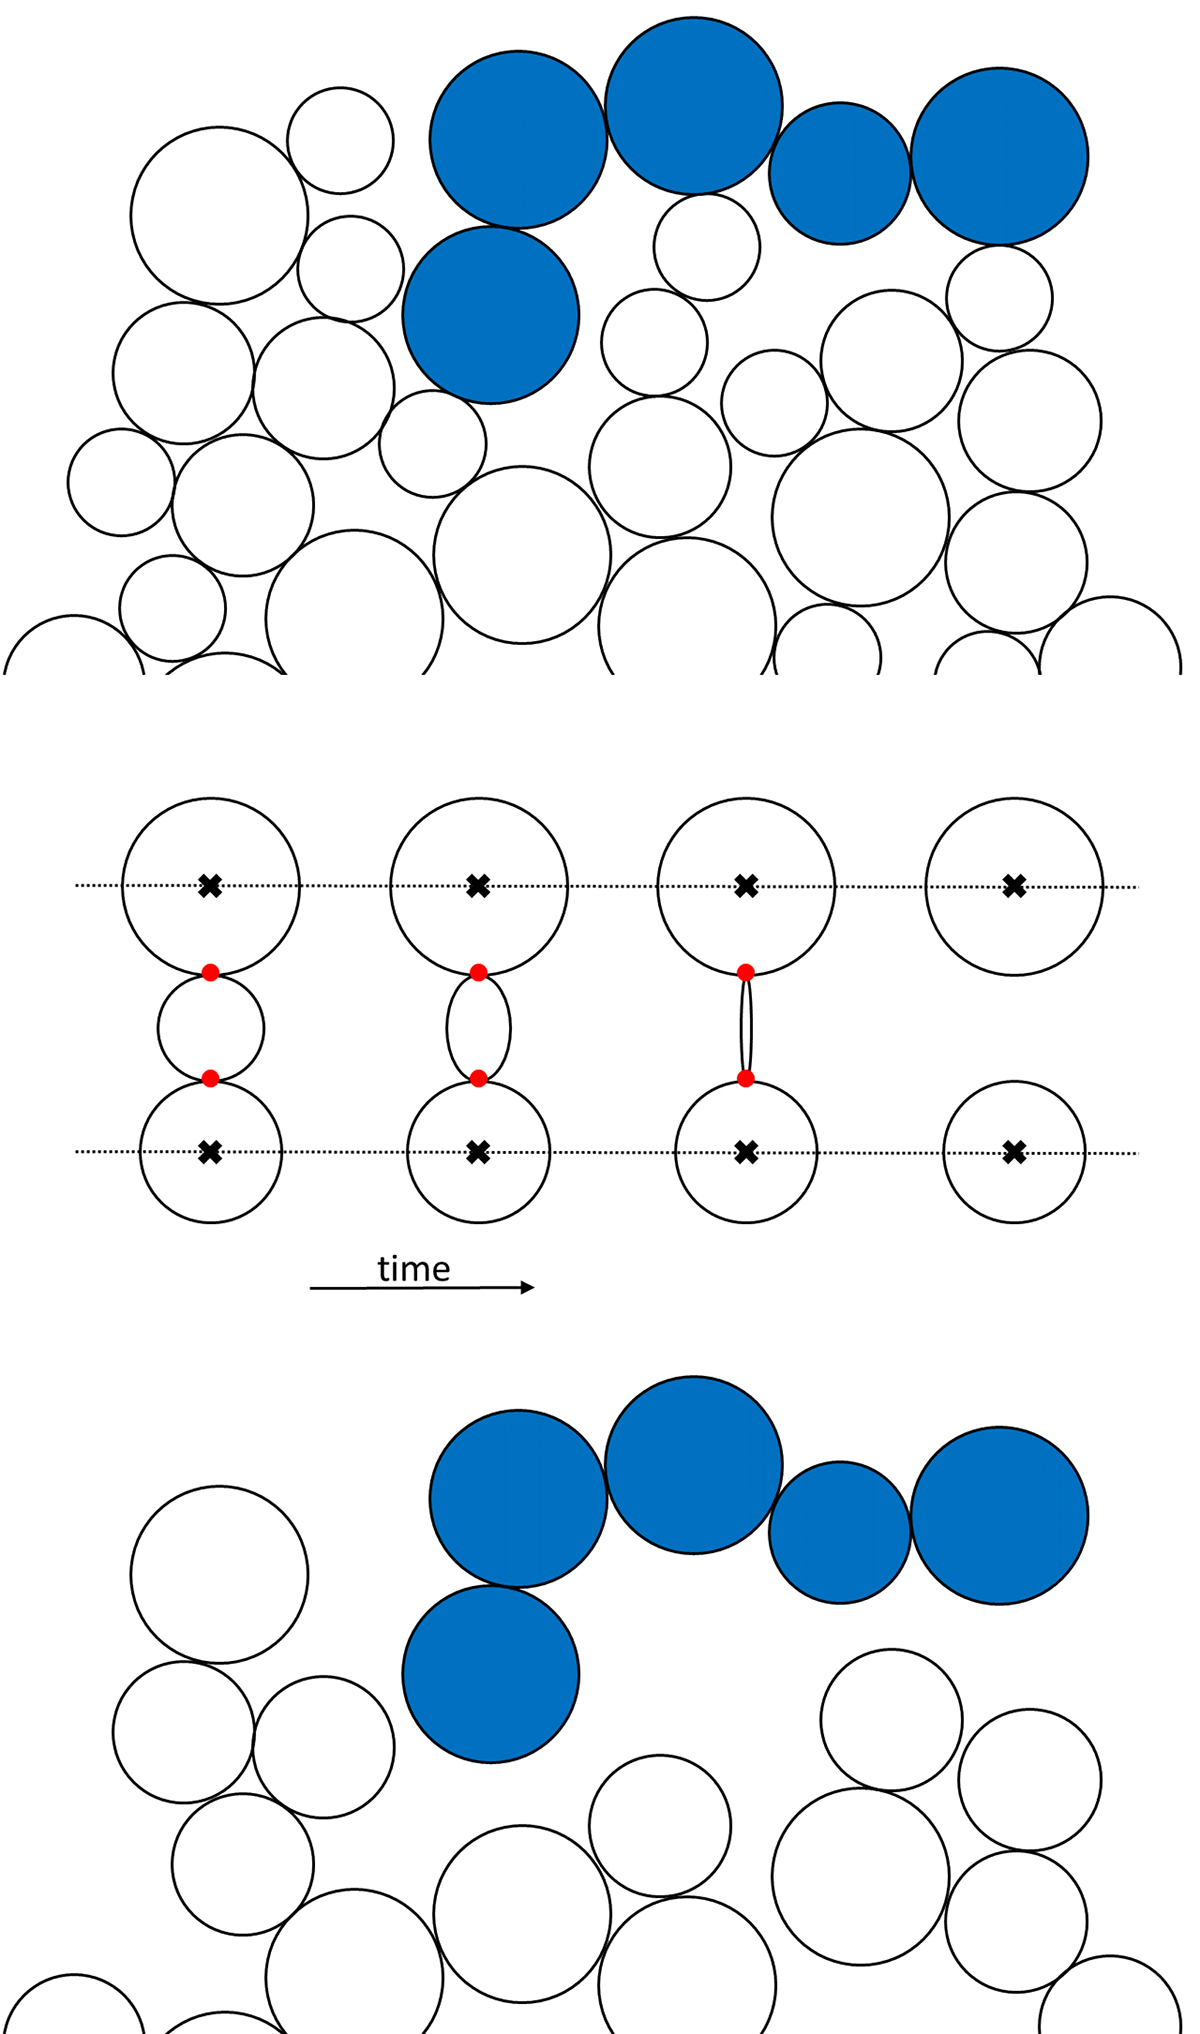
Schematic representation of the geometrical model. Top: 2D representation of the sphere-cluster model, here for simplicity with only three different ice-sphere sizes. Centre: treatment of the evaporation of an ice sphere. A small ice sphere is in contact with two larger neighbours whose centres (marked by the black crosses) are fixed by external processes; for example, by being constrained in a network of other particles. Time proceeds from left to right. In this visualisation, it is assumed that the small sphere in the centre evaporates on a shorter timescale than its two larger neighbours. The red dots mark the contacts between the central sphere and its neighbours, which disappear when the central sphere has evaporated. In the simulations, only the last step (shown on the right) is considered, that is, the evaporation of the ice particles is not explicitly treated. Bottom: after the evaporation of the smallest ice spheres, an isolated cluster (depicted in blue) is detached from the bulk of the sample. This cluster is assumed to be emitted in solid form.
Current usage metrics show cumulative count of Article Views (full-text article views including HTML views, PDF and ePub downloads, according to the available data) and Abstracts Views on Vision4Press platform.
Data correspond to usage on the plateform after 2015. The current usage metrics is available 48-96 hours after online publication and is updated daily on week days.
Initial download of the metrics may take a while.