Fig. B.3.
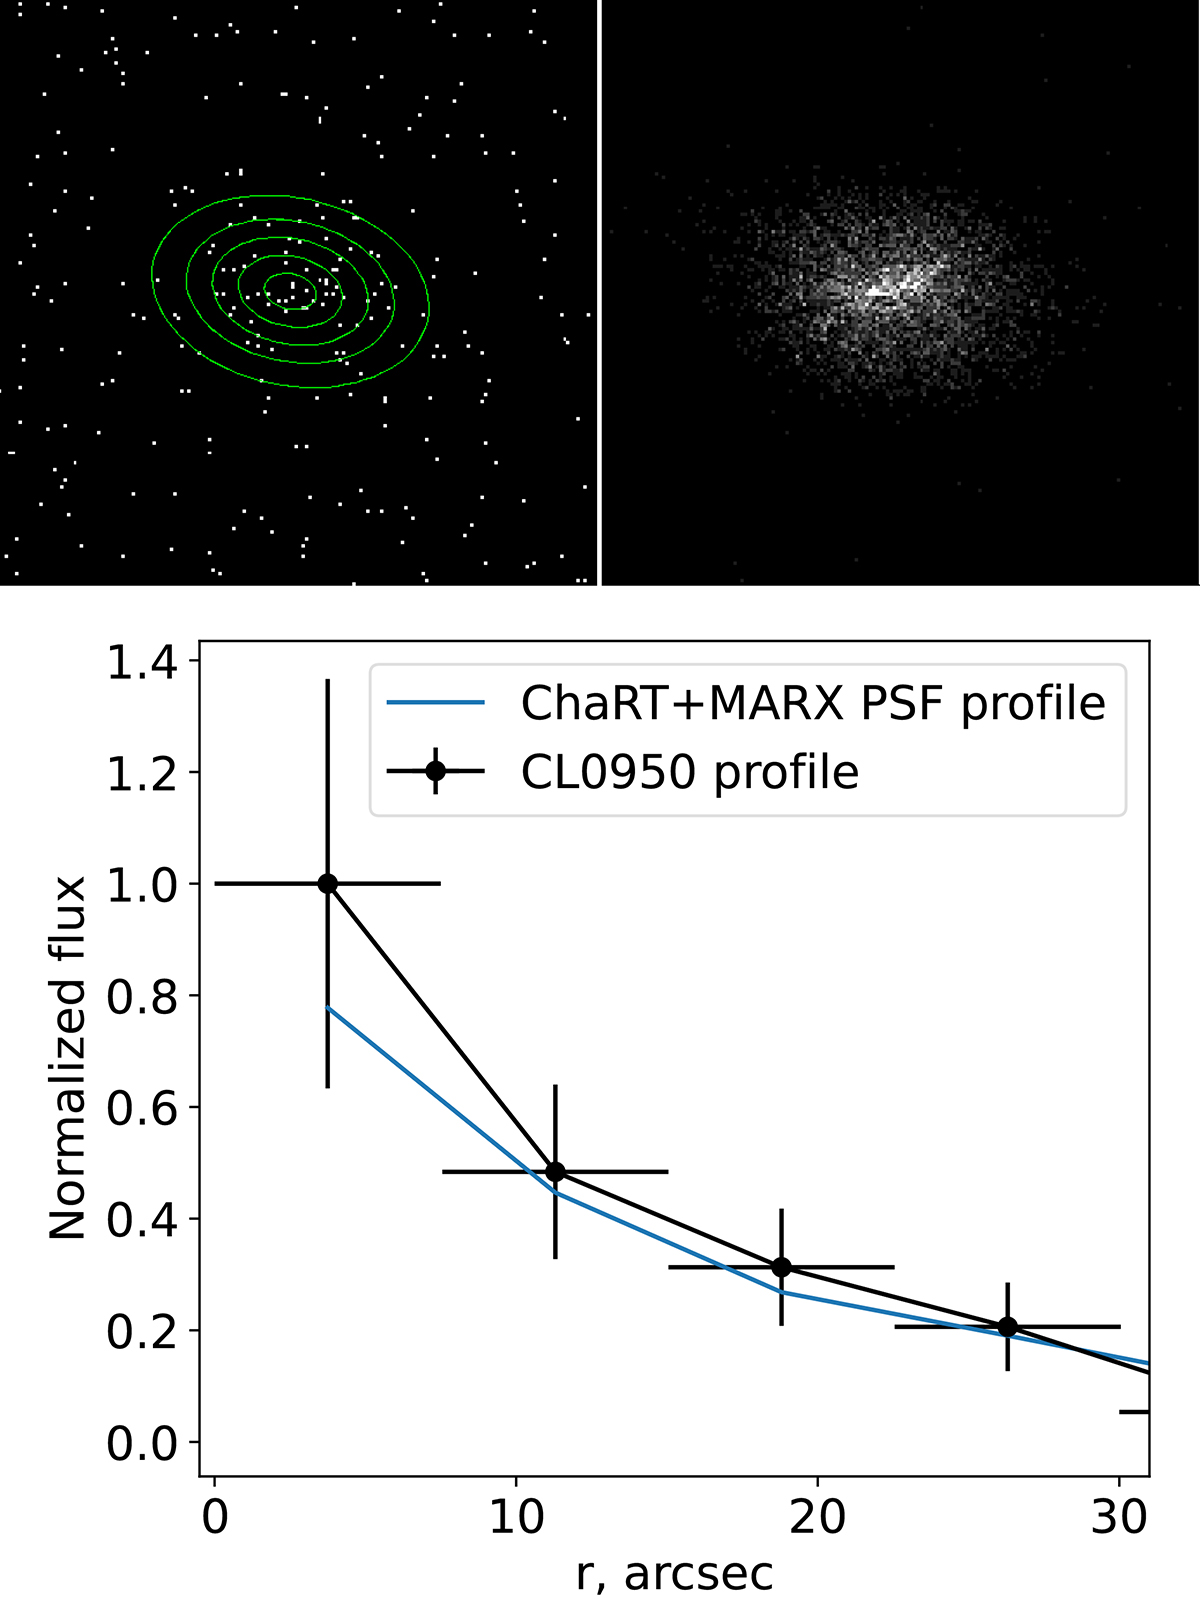
Download original image
Upper panel: Chandra image of CARLA J0950+2743 (left) and simulated PSF (right) with overlapped the elliptical annuli used for the 1D signal profile (in green). All regions are centered on the AGN. Lower panel: Radial profile of the detected photons per unit area in the Chandra dataset centering on the CARLA J0950+2743 AGN, compared to the simulated Chandra PSF radial profile (in black). Both profiles are normalized to the total number of net counts found in the extraction regions (see upper panel).
Current usage metrics show cumulative count of Article Views (full-text article views including HTML views, PDF and ePub downloads, according to the available data) and Abstracts Views on Vision4Press platform.
Data correspond to usage on the plateform after 2015. The current usage metrics is available 48-96 hours after online publication and is updated daily on week days.
Initial download of the metrics may take a while.