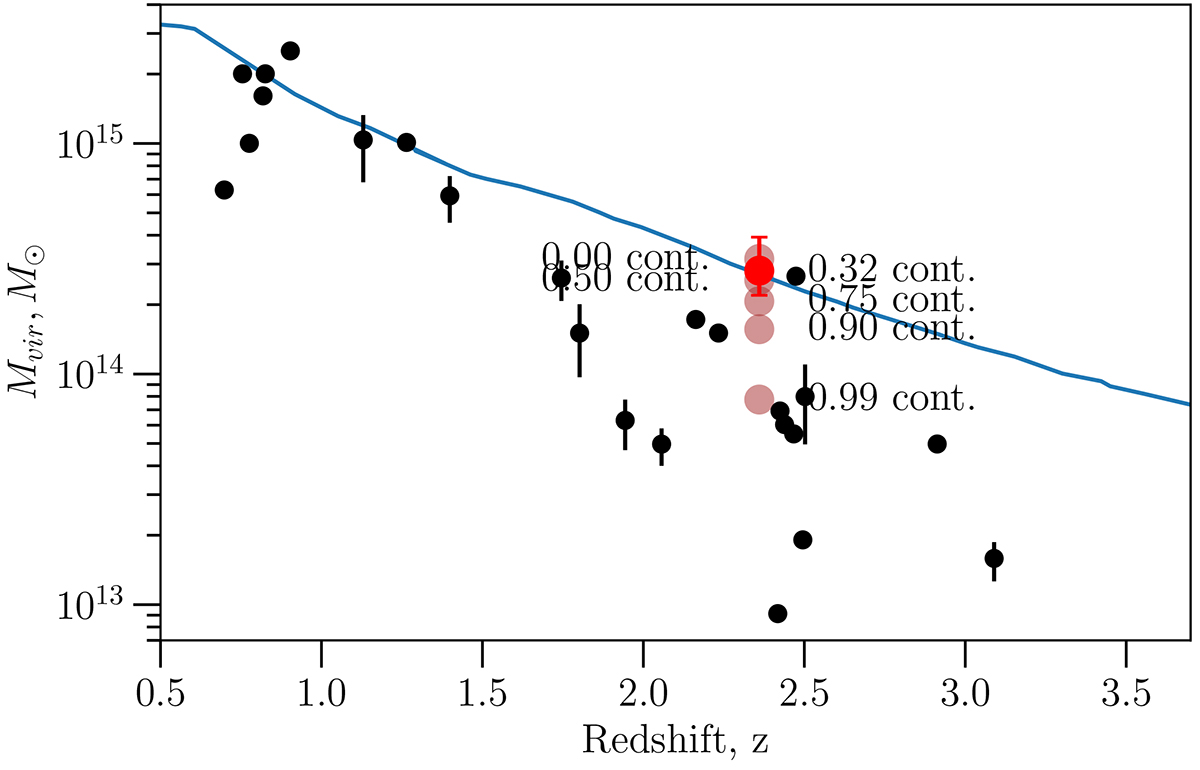
Fig. 4.
Download original image
Comparison of the mass estimate for CARLA J0950+2743 for different contamination levels from 0 to 99% (brown points), including the most realistic value of 32% (red point) with measurements for other structures (black points), compiled in Remus et al. (2023), which includes clusters from Shimasaku et al. (2003), Venemans et al. (2004), Ouchi et al. (2005), Toshikawa et al. (2012, 2014), Higuchi et al. (2019). Chanchaiworawit et al. (2019), Toshikawa et al. (2020), Calvi et al. (2021) and the virial mass of the most massive halo in the snapshots at different redshifts (blue line) for the Box 0 simulation set.
Current usage metrics show cumulative count of Article Views (full-text article views including HTML views, PDF and ePub downloads, according to the available data) and Abstracts Views on Vision4Press platform.
Data correspond to usage on the plateform after 2015. The current usage metrics is available 48-96 hours after online publication and is updated daily on week days.
Initial download of the metrics may take a while.