Fig. 2.
Download original image
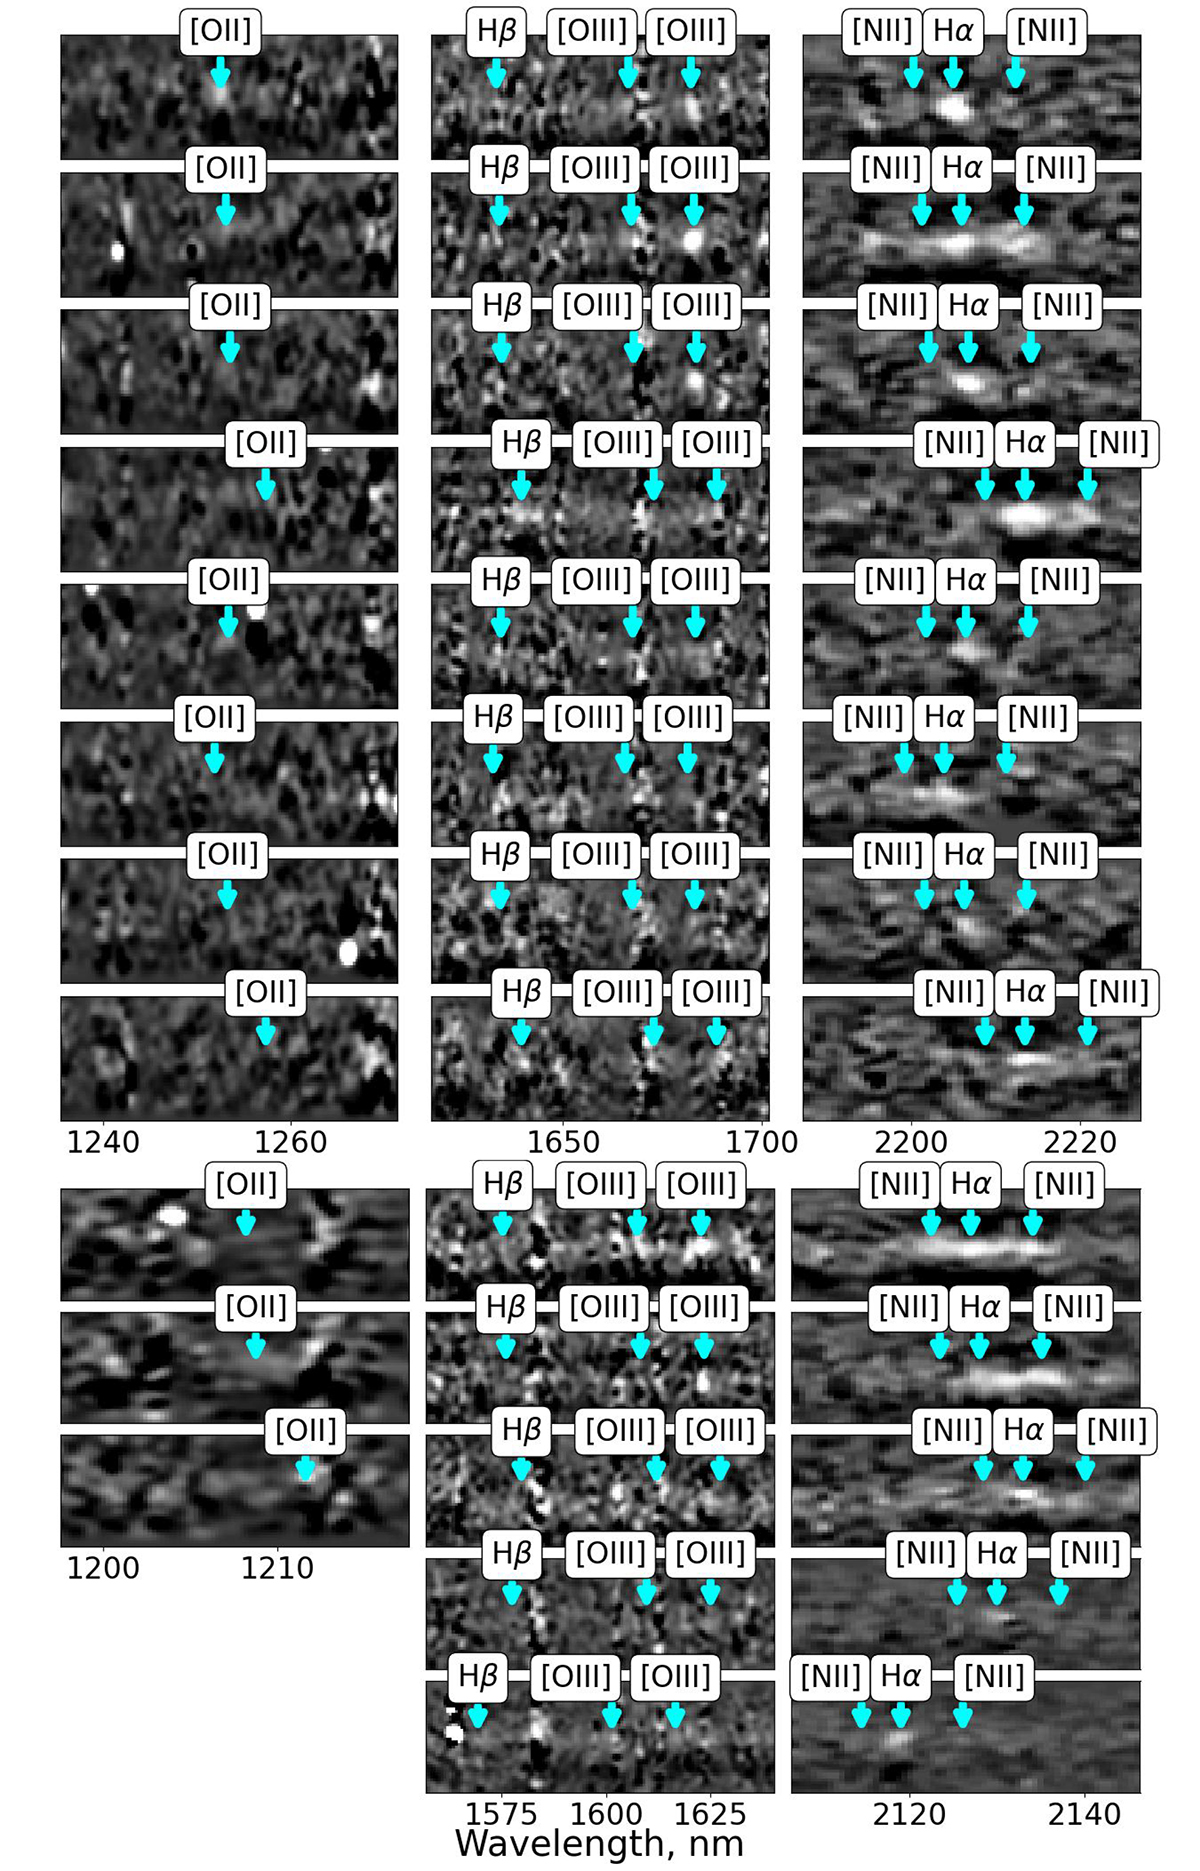
Parts of the reduced coadded 2D MMIRS spectra for the eight spectroscopically confirmed cluster members in CARLA J0950+2743 at z = 2.363 ± 0.005 (top) and for five spectroscopically confirmed cluster members in CARLA-Ser J0950+2743 at z = 2.243 ± 0.008 (bottom). The cyan arrows indicate the positions of redshifted Hα+[NII], Hβ, [O III], and [OII] emission lines. The extracted 1D spectra are shown in Figure A.1.
Current usage metrics show cumulative count of Article Views (full-text article views including HTML views, PDF and ePub downloads, according to the available data) and Abstracts Views on Vision4Press platform.
Data correspond to usage on the plateform after 2015. The current usage metrics is available 48-96 hours after online publication and is updated daily on week days.
Initial download of the metrics may take a while.