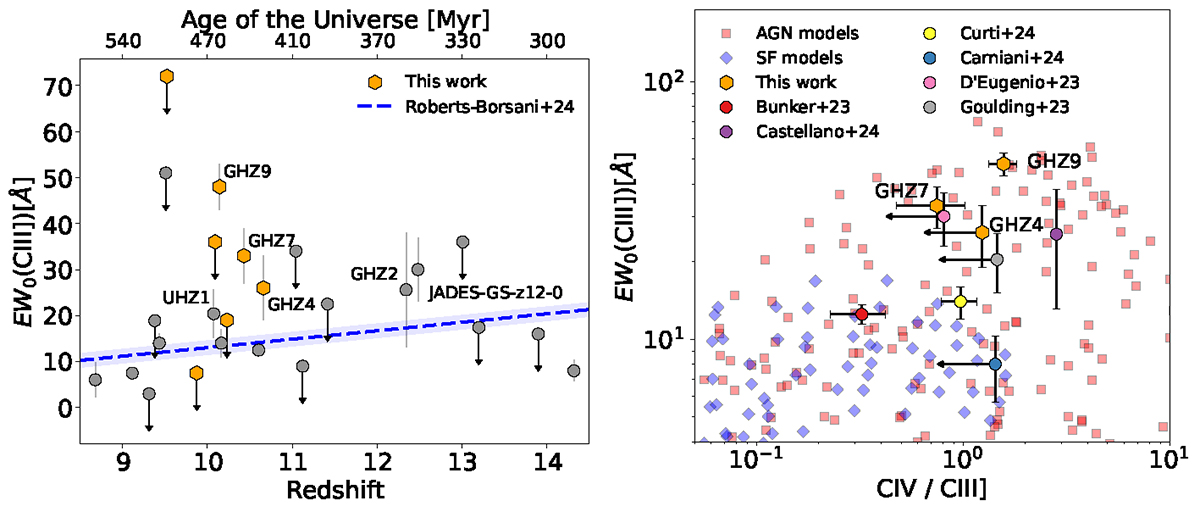
Fig. 5.
Download original image
Diagnostic analysis of CIII]λ1909 emission line. Left: Redshift evolution of the EW0 of CIII]λ1909. The best-fit relation found by Roberts-Borsani et al. (2024) is indicated by the blue dashed line. We present both measurements and upper limits. The orange hexagons represent our results, while results from the literature are shown as grey circles (Arrabal Haro et al. 2023a; Bunker et al. 2023; D’Eugenio et al. 2024; Hsiao et al. 2024a; Goulding et al. 2023; Larson et al. 2023; Stiavelli et al. 2023; Williams et al. 2023; Boyett et al. 2024; Carniani et al. 2024; Castellano et al. 2024; Curti et al. 2024; Hainline et al. 2024; Schaerer et al. 2024; Witstok et al. 2024). Right: Diagnostic diagram based on CIII]λ1909 and CIVλλ1548,51 emission lines. The AGN and star-forming models from Nakajima & Maiolino (2022) are displayed as red squares and blue diamonds, respectively. We include a subset of the sources shown in the left plot, where measurements or limits for CIVλλ1548,51 are available.
Current usage metrics show cumulative count of Article Views (full-text article views including HTML views, PDF and ePub downloads, according to the available data) and Abstracts Views on Vision4Press platform.
Data correspond to usage on the plateform after 2015. The current usage metrics is available 48-96 hours after online publication and is updated daily on week days.
Initial download of the metrics may take a while.