Open Access
Fig. 4.
Download original image
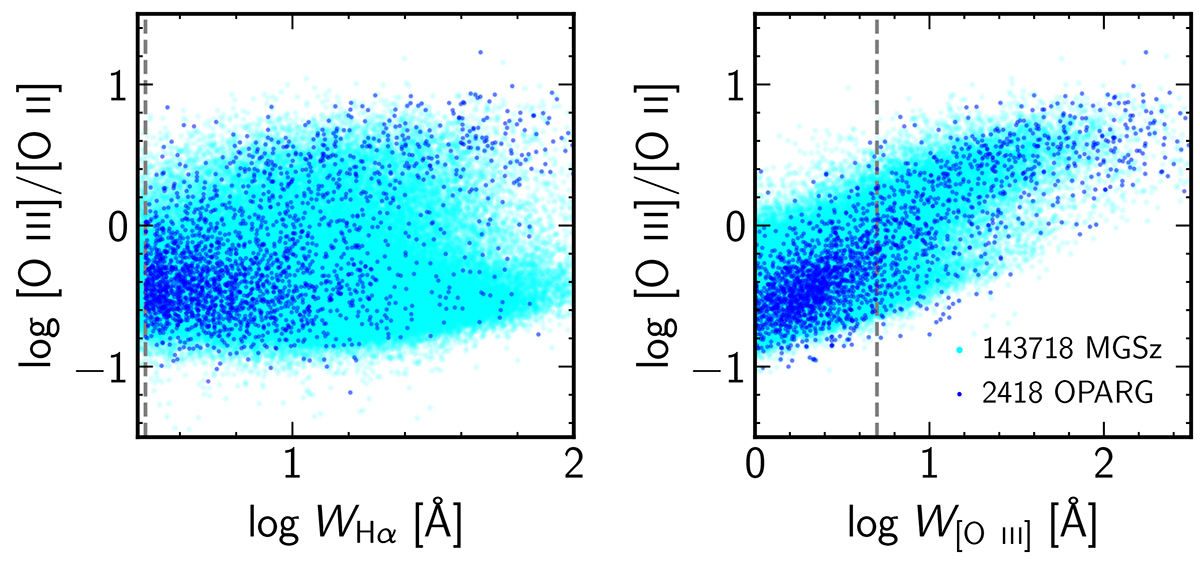
Excitation ratio [O III]/[O II] as a function of W(Hα) (left) and W[O III] (right). Only objects with a S/N of at least of 3 have been plotted. Dark blue is for OPARGs. Cyan is for ‘active’ galaxies from the MGSz sample according to the Stasińska et al. (2006) line (see text).
Current usage metrics show cumulative count of Article Views (full-text article views including HTML views, PDF and ePub downloads, according to the available data) and Abstracts Views on Vision4Press platform.
Data correspond to usage on the plateform after 2015. The current usage metrics is available 48-96 hours after online publication and is updated daily on week days.
Initial download of the metrics may take a while.