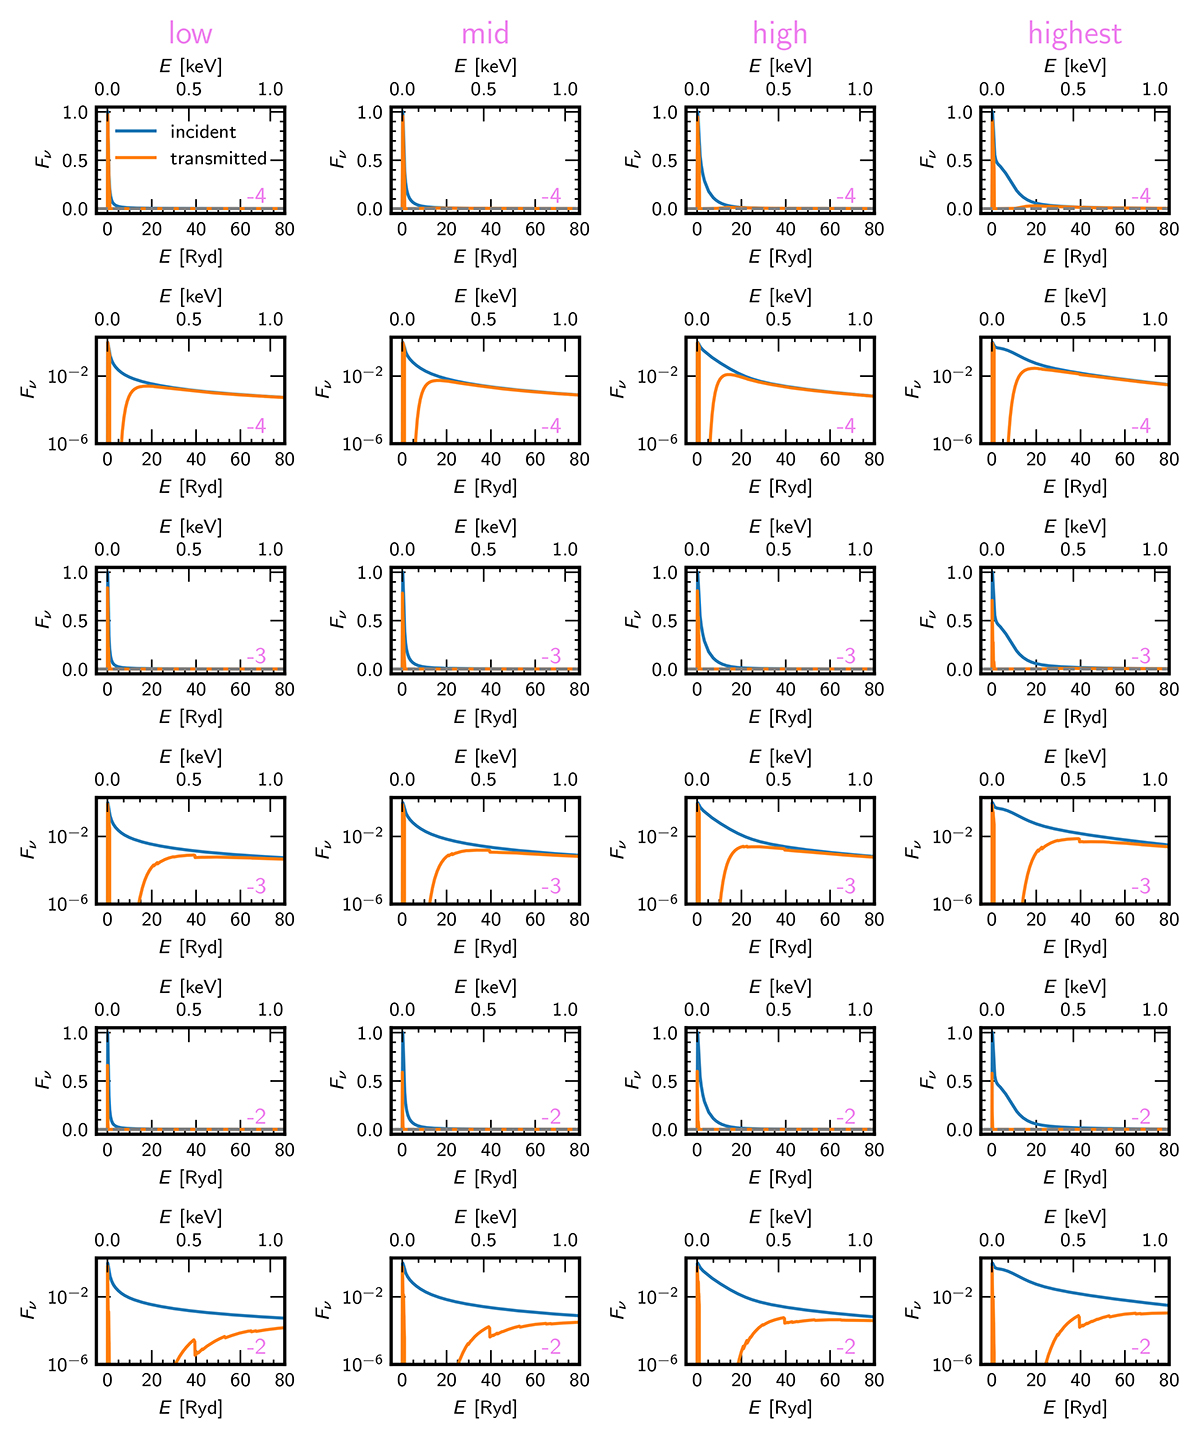
Fig. B.1.
Download original image
Incident (blue) and transmitted (orange) SEDs for the dusty models. From left to right, we show the low, mid, high and highest SEDs (see text for details). Each SED is shown twice, with the ordinate both in linear (top) and logarithmic (bottom) scales. Numbers at the bottom right are the values of log U for each model. Models for log U = −2.5 and −3.5 are not shown.
Current usage metrics show cumulative count of Article Views (full-text article views including HTML views, PDF and ePub downloads, according to the available data) and Abstracts Views on Vision4Press platform.
Data correspond to usage on the plateform after 2015. The current usage metrics is available 48-96 hours after online publication and is updated daily on week days.
Initial download of the metrics may take a while.