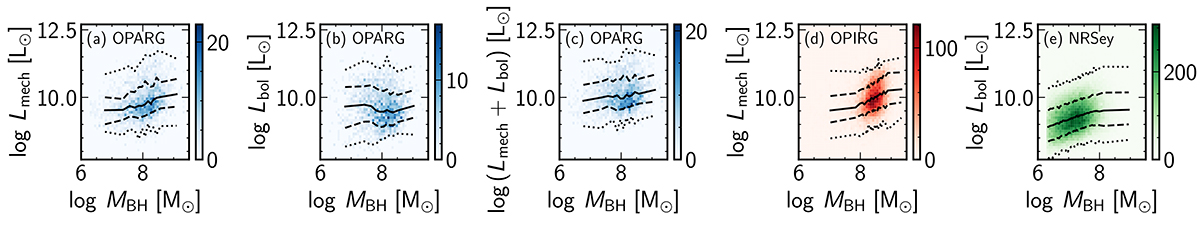
Fig. 22.
Download original image
2D histograms of energy outputs versus black hole mass for the different categories of AGN galaxies. The two leftmost panels show (a) the mechanical energy output for OPARG and (b) the radiative energy output for OPARGs. The three rightmost panels show the total energy output for (c) OPARGs, (d) OPIRGs and (e) non-radio Seyferts. The colour-scale gives the number of objects in each bin. The curves show the value of the median (solid line), the 16 and 84 percentiles (dashed lines) and 1 and 99 percentiles (dotted lines) as a function of black hole mass.
Current usage metrics show cumulative count of Article Views (full-text article views including HTML views, PDF and ePub downloads, according to the available data) and Abstracts Views on Vision4Press platform.
Data correspond to usage on the plateform after 2015. The current usage metrics is available 48-96 hours after online publication and is updated daily on week days.
Initial download of the metrics may take a while.