Fig. 3.
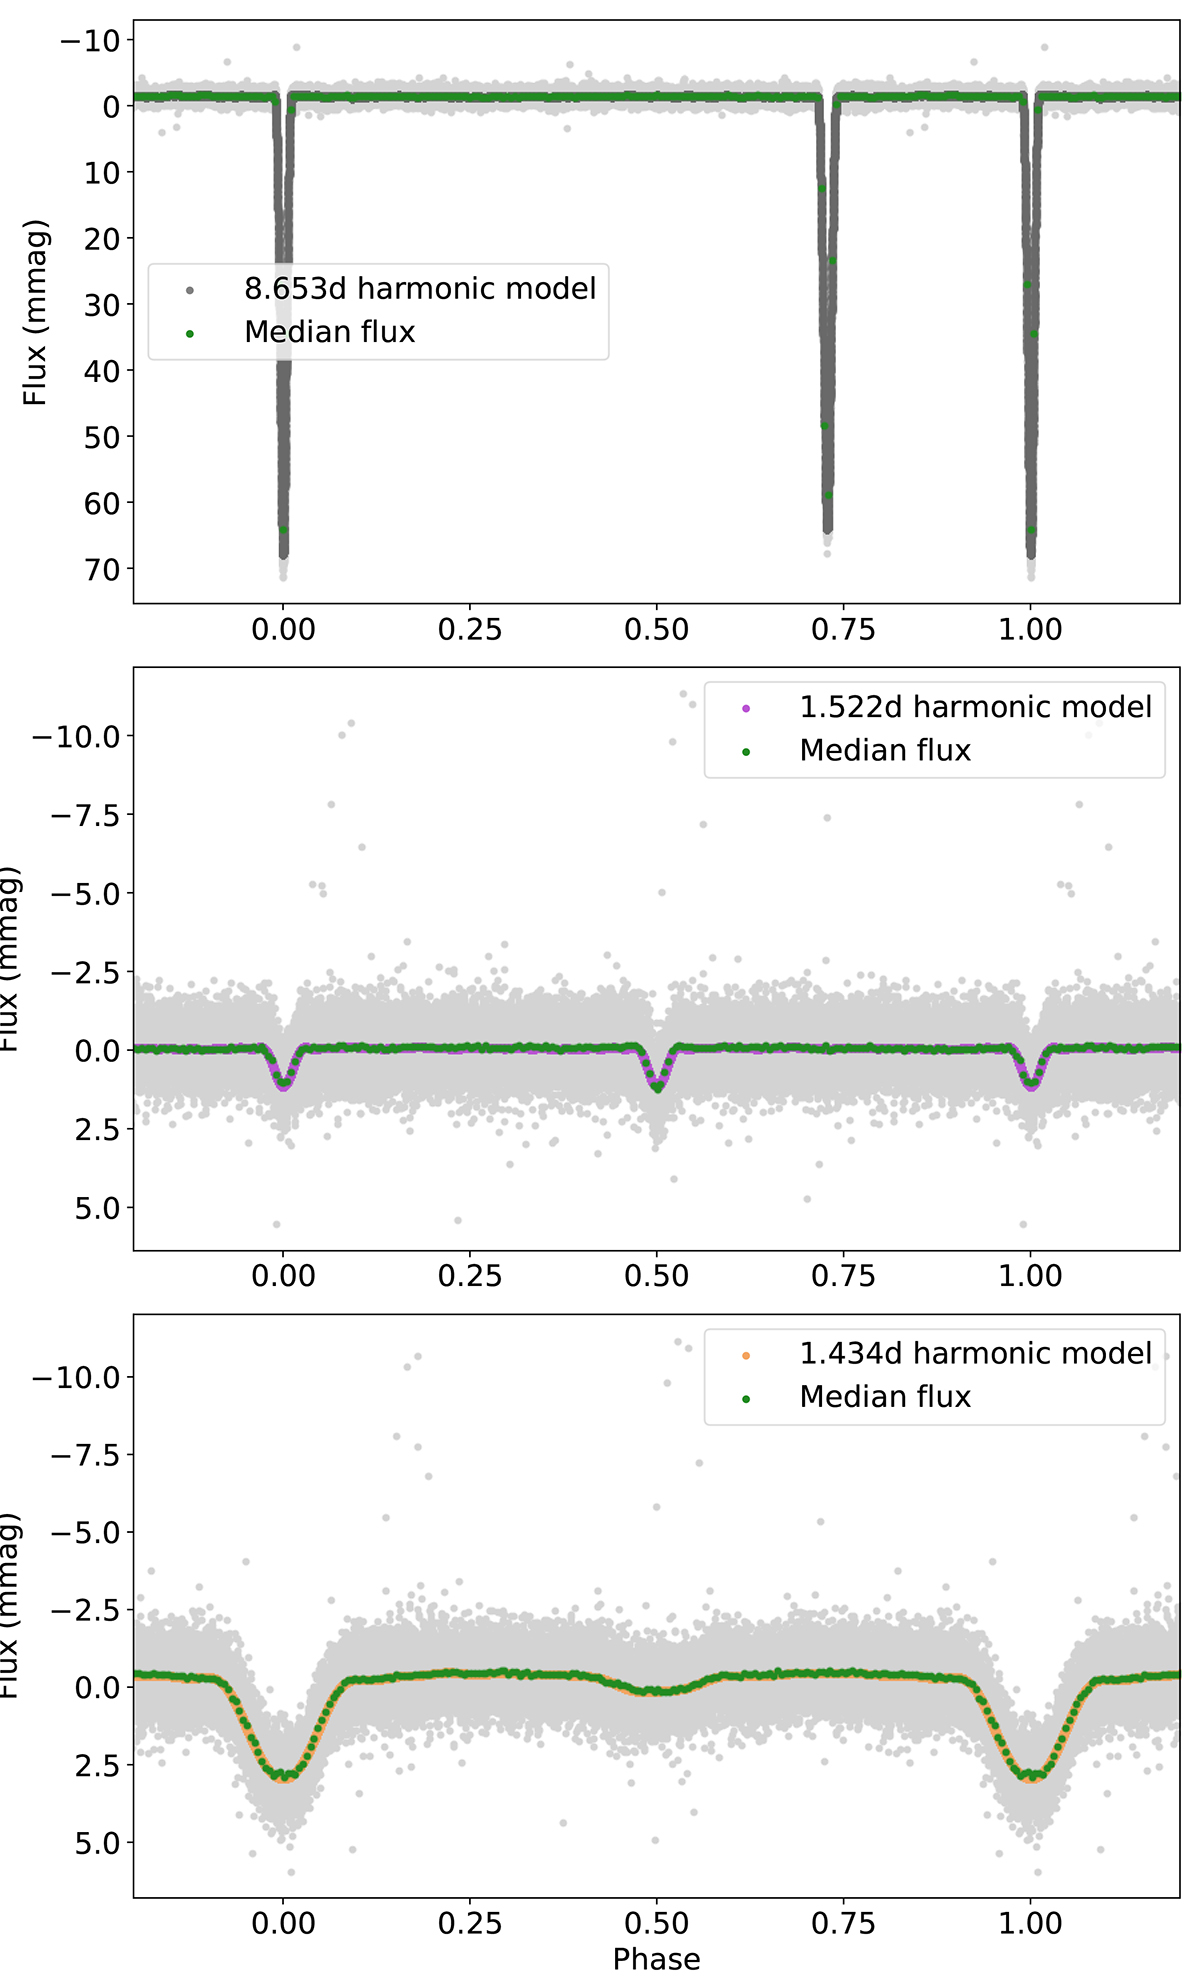
Download original image
Phase-folded light curves for each of the eclipsing components and its sinusoid model. The light curve (grey data) for each is the residual between the normalised, detrended light curve and every frequency except those forming the sinusoid model of the relevant eclipse from STAR SHADOW. The median flux is shown in green, and the coloured points (colour varies by panel) are from the relevant harmonic model. Figure 3 of Kemp et al. (2024) shows the equivalent figure for the period04 extraction, with no significant eclipse geometry differences.
Current usage metrics show cumulative count of Article Views (full-text article views including HTML views, PDF and ePub downloads, according to the available data) and Abstracts Views on Vision4Press platform.
Data correspond to usage on the plateform after 2015. The current usage metrics is available 48-96 hours after online publication and is updated daily on week days.
Initial download of the metrics may take a while.