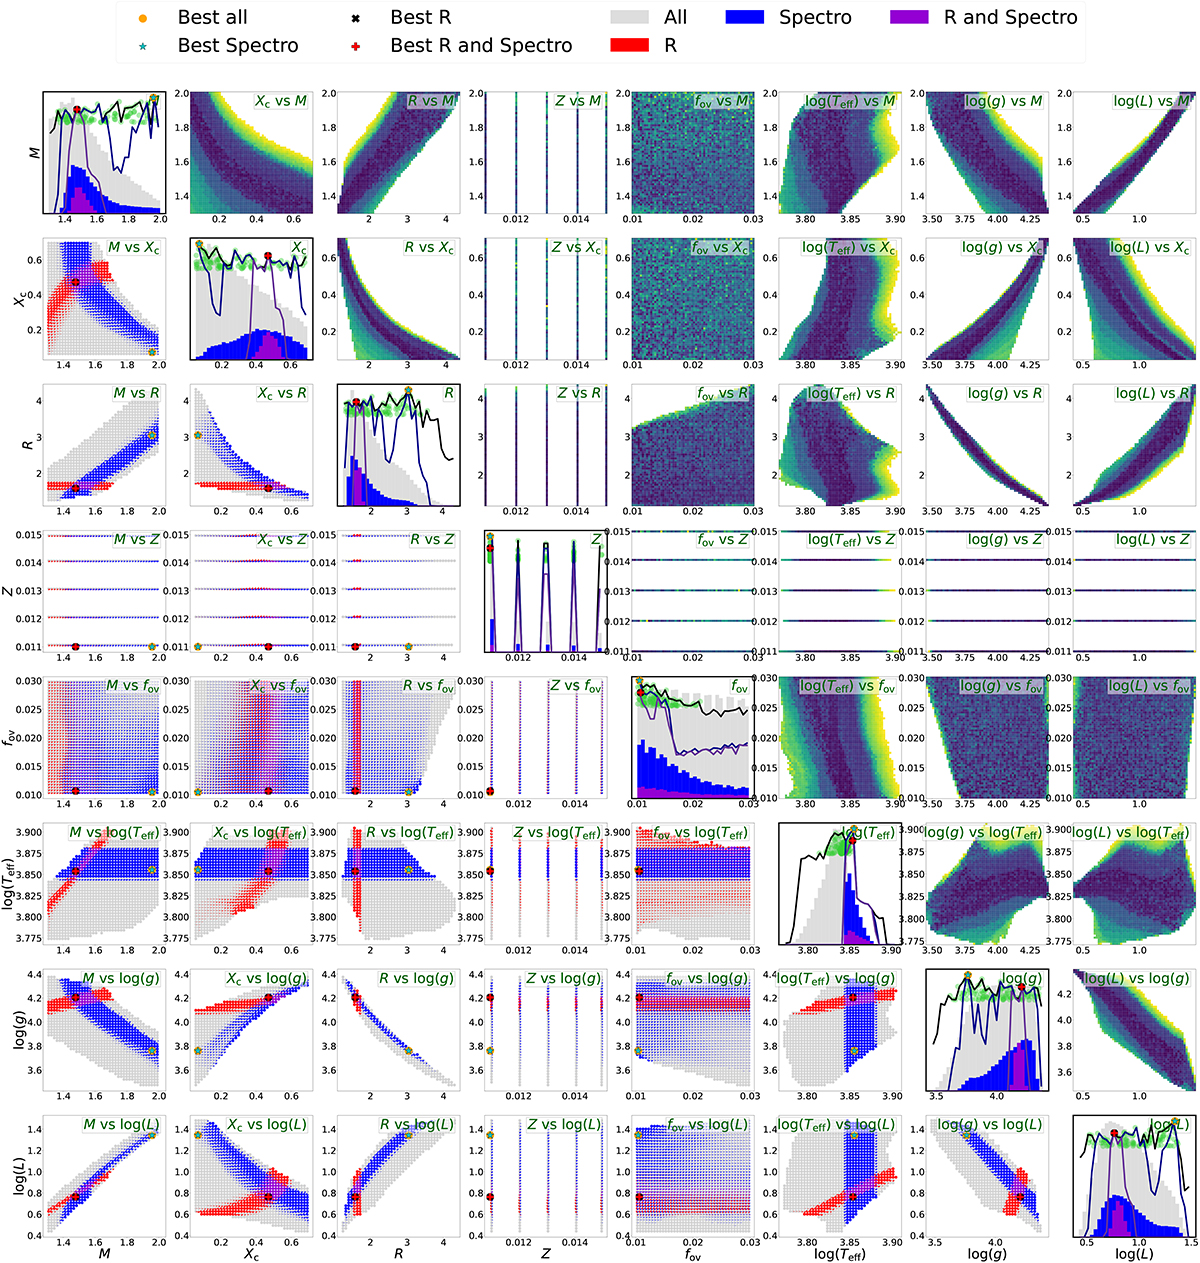
Fig. B.1.
Download original image
PAT_LI2020 modelling results. The main diagonal (emphasised with thicker panel outlines) shows the 1/χ2 envelopes (the maximum value of 1/χ2 per bin; solid lines) and histograms of the 1/χ2 values for each variable along the x-axis when considering purely the asteroseismic fit (All; grey), when only considering models that fall within spectroscopic constraints on log(g) and Teff (Spectro; blue), and when considering only models that satisfy both the spectroscopic constraints and constraints on the stellar radius from eclipse modelling (R and Spectro; purple). Best-fitting models are shown for each case. The green markers indicate the 100 best-fitting models. The lower triangular panels are ‘scatter pies’ (see the main text) showing how the different external constraints intersect along each 2D projection of the parameter space, with the best-fitting models also shown. The upper triangular panels show the maximum value of 1/χ2 for each 2D bin (logarithmic scale, with dark colouration indicating a better fit).
Current usage metrics show cumulative count of Article Views (full-text article views including HTML views, PDF and ePub downloads, according to the available data) and Abstracts Views on Vision4Press platform.
Data correspond to usage on the plateform after 2015. The current usage metrics is available 48-96 hours after online publication and is updated daily on week days.
Initial download of the metrics may take a while.