Fig. 8
Download original image
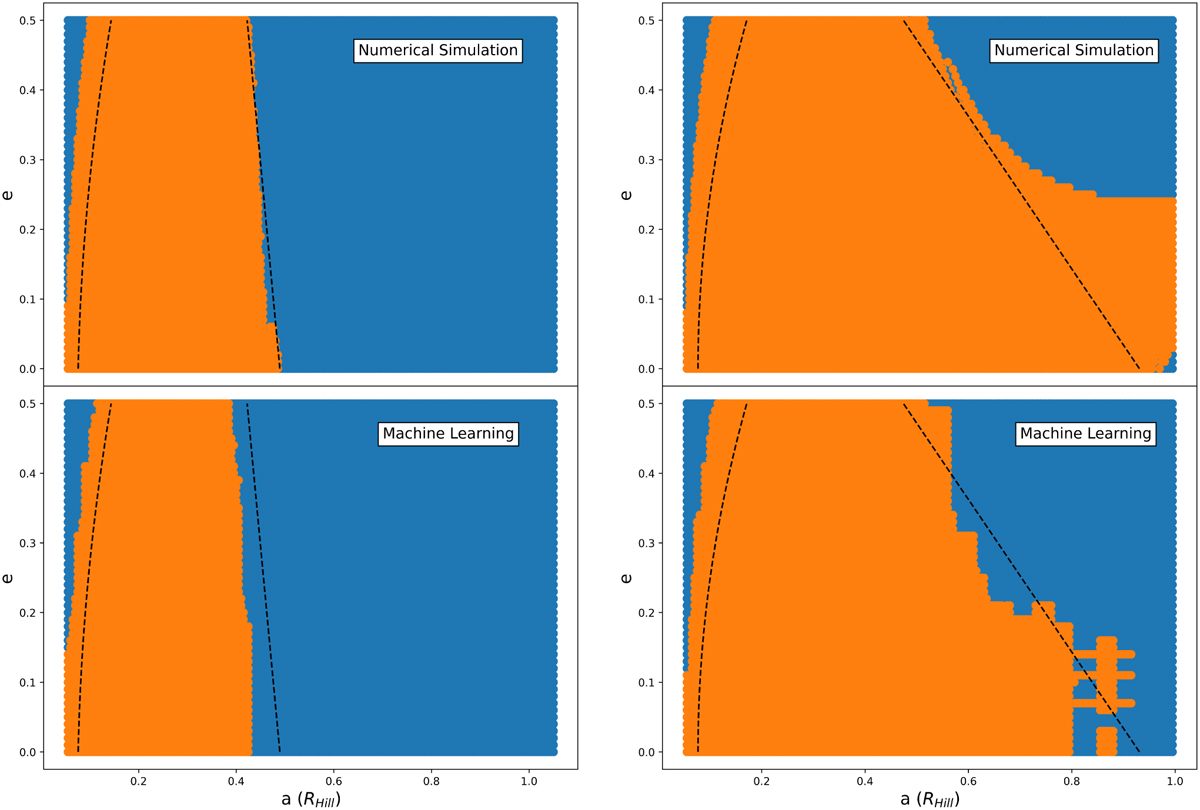
Comparison of numerical simulations (upper panels) and ML predicted outcomes (lower panels) for stable (orange) and unstable (blue) particles. The initial conditions match those from Domingos et al. (2006) for µ = 10−3, with i = 0° (left) and i = 180° (right). The dashed lines represent the analytical expression from Domingos et al. (2006).
Current usage metrics show cumulative count of Article Views (full-text article views including HTML views, PDF and ePub downloads, according to the available data) and Abstracts Views on Vision4Press platform.
Data correspond to usage on the plateform after 2015. The current usage metrics is available 48-96 hours after online publication and is updated daily on week days.
Initial download of the metrics may take a while.