Open Access
Fig. 5
Download original image
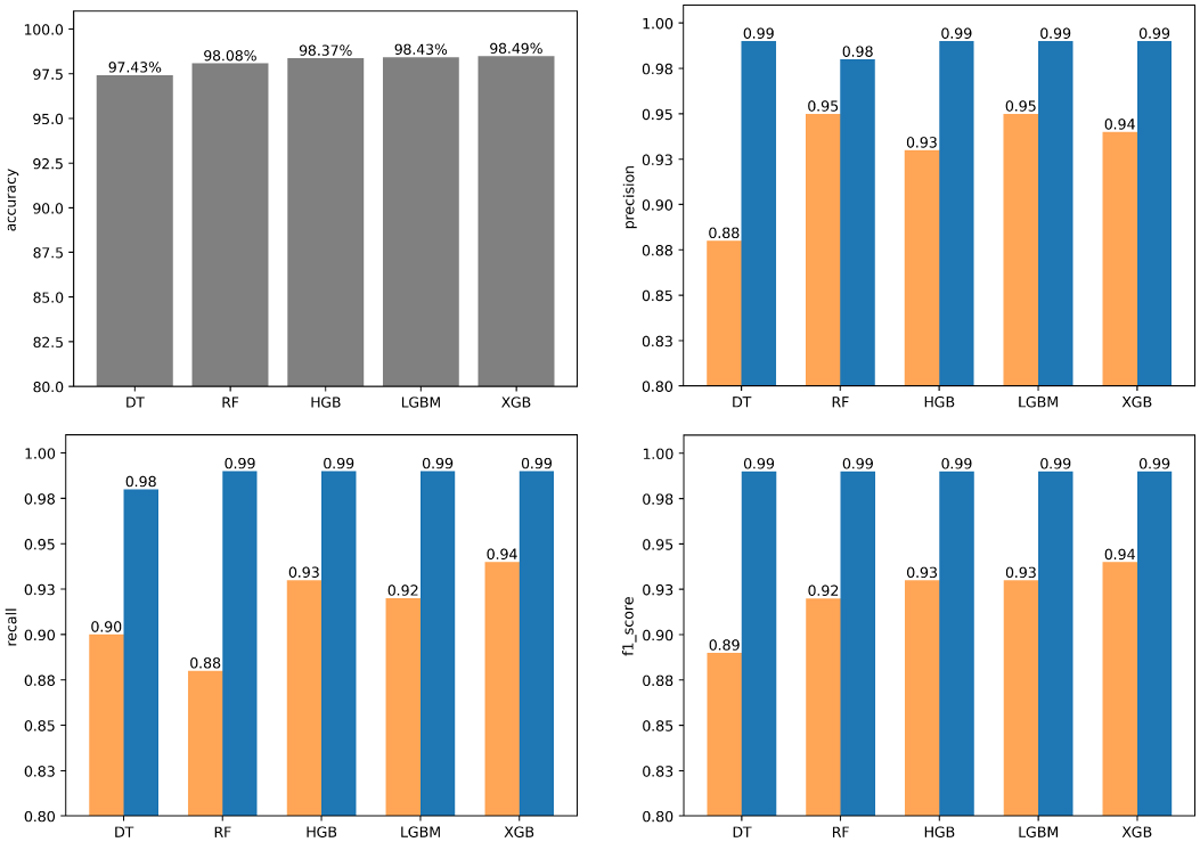
Performance of the best model of the five tested algorithms. The upper panels show accuracy and precision, and the lower panels show recall and F1-score. The stable and unstable classes are represented by orange and blue bars, respectively. The algorithms are abbreviated as follows: DT, RF, HGB, LGBM, and XGB.
Current usage metrics show cumulative count of Article Views (full-text article views including HTML views, PDF and ePub downloads, according to the available data) and Abstracts Views on Vision4Press platform.
Data correspond to usage on the plateform after 2015. The current usage metrics is available 48-96 hours after online publication and is updated daily on week days.
Initial download of the metrics may take a while.