Open Access
Fig. 9.
Download original image
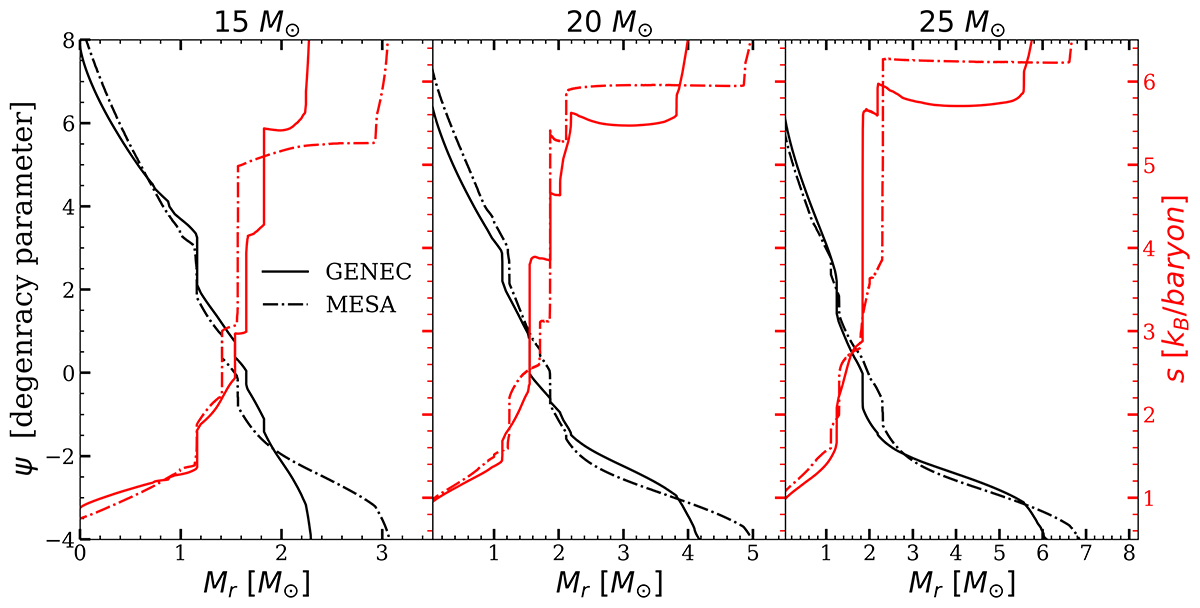
Entropy per baryon (red) and the degeneracy parameter Ψ (black), as a function of mass for the pre-collapse models (see Appendix B for details on the degeneracy parameter). The solid and dash-dotted lines correspond to the GENEC and MESA models, respectively. From left to right, we show the 15 M⊙, 20 M⊙, and 25 M⊙ models.
Current usage metrics show cumulative count of Article Views (full-text article views including HTML views, PDF and ePub downloads, according to the available data) and Abstracts Views on Vision4Press platform.
Data correspond to usage on the plateform after 2015. The current usage metrics is available 48-96 hours after online publication and is updated daily on week days.
Initial download of the metrics may take a while.