Fig. 6.
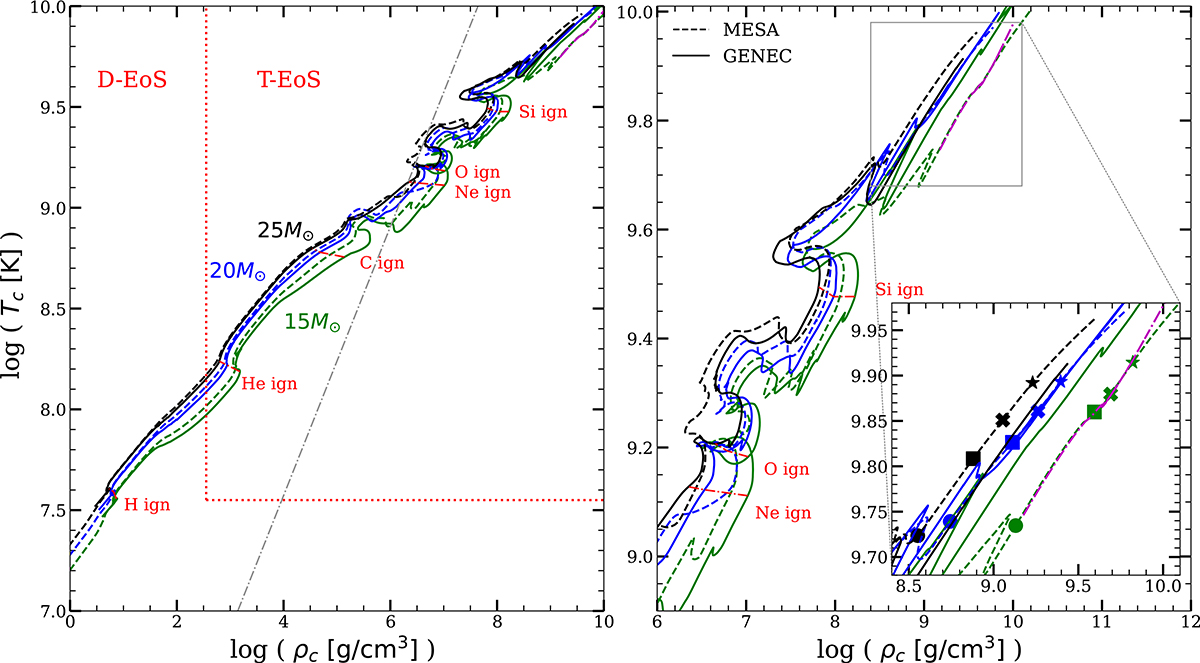
Download original image
Evolution of central conditions for all models. Left: Evolution of the central temperature with respect to central density for all models. The GENEC models are shown as solid lined and the MESA models as dashed. The 15 M⊙ models are in green, 20 M⊙ in blue, and 25 M⊙ in black. The magenta dash-dotted line is a 15 M⊙ MESA model run without the acceleration term for comparison (only the very end of the evolution is shown because the prior evolution is identical to the other MESA model). The grey dash-dotted line shows the limit between non-degenerate and degenerate electron gas. The red dotted lines seperate the regime where the D-EoS is applied and when the T-EoS is used, as given by Eq. (1). The beginning of each burning phase is indicated. Right: Zoommed-in image for the same models. In the inset we further zoom in on the very final evolution phase, post-silicon core burning; for the MESA models markers indicate the central conditions at times of 1000 s (circles), 100 s (squares), 10 s (crosses), and 1 s (stars) before collapse.
Current usage metrics show cumulative count of Article Views (full-text article views including HTML views, PDF and ePub downloads, according to the available data) and Abstracts Views on Vision4Press platform.
Data correspond to usage on the plateform after 2015. The current usage metrics is available 48-96 hours after online publication and is updated daily on week days.
Initial download of the metrics may take a while.