Fig. 4.
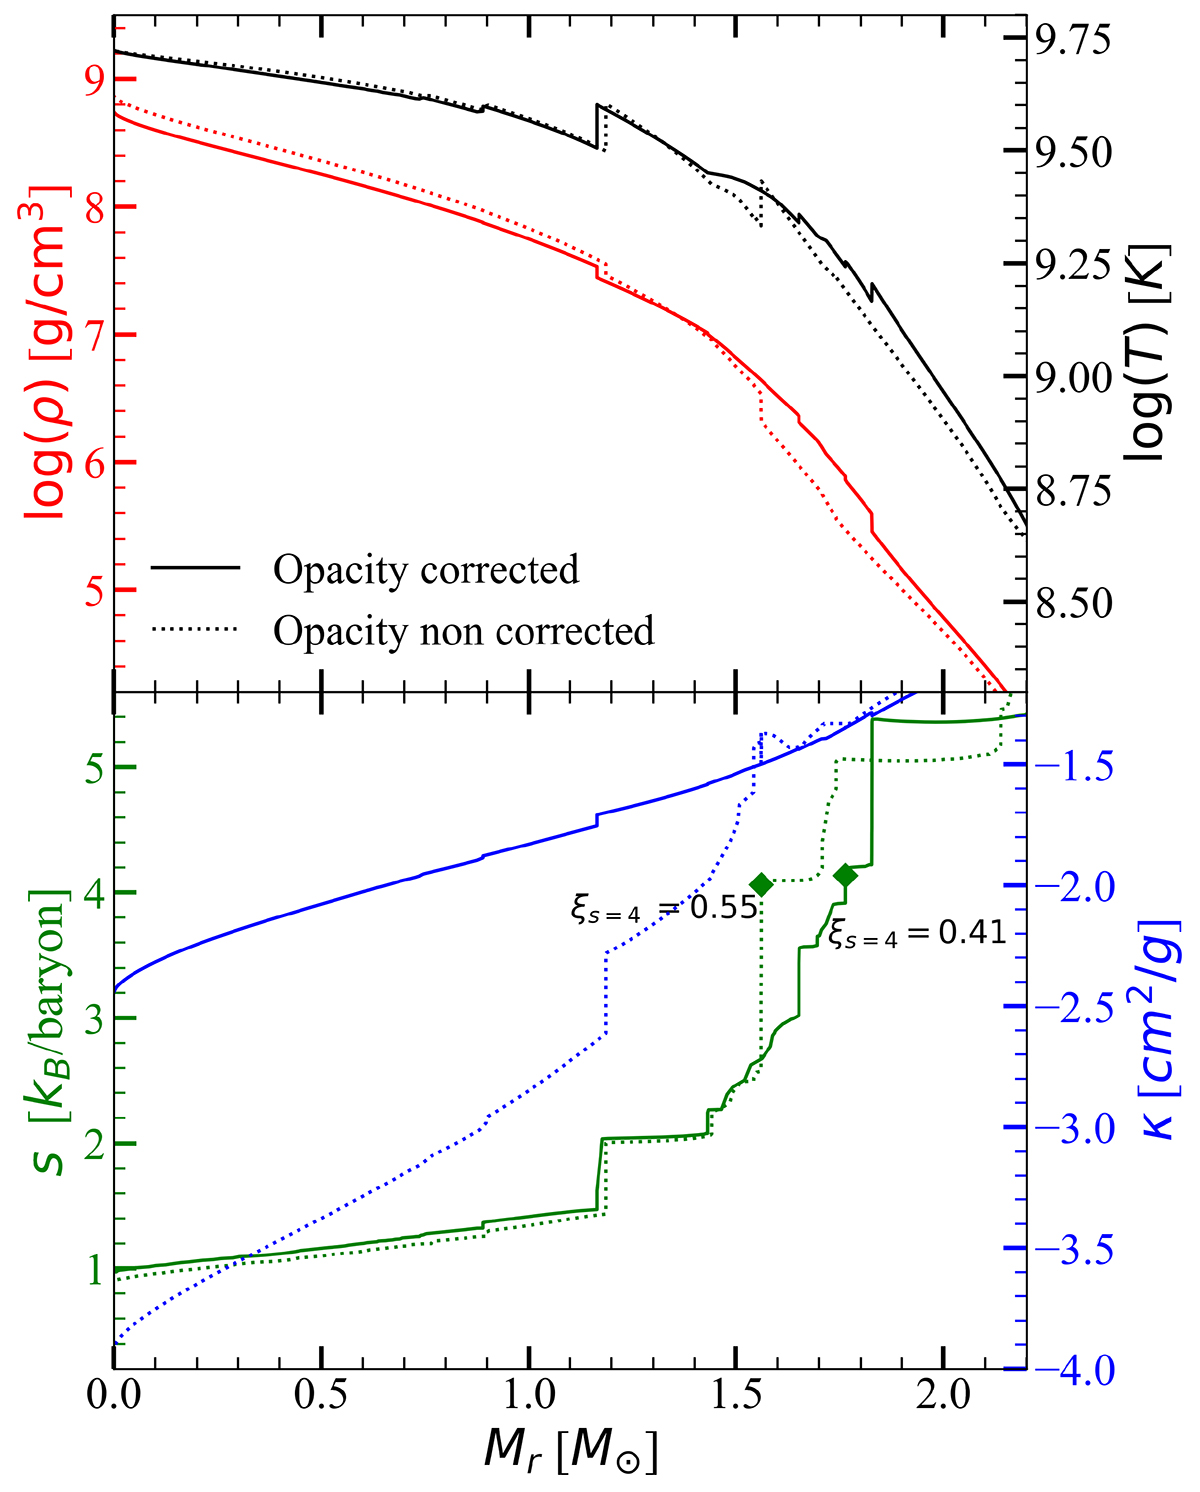
Download original image
Thermodynamic variables plotted for 15 M⊙, with and without the opacity corrections. The model is plotted during silicon shell burning some minutes before collapse. The solid line shows the model using the opacity upgrades for the radiative and conductive opacity as detailed in Sect. 3. The dotted line shows the model run with the opacity previously implemented in GENEC. We display the compactness at an entropy per baryon s = 4, computed using the definition in Eq. (24).
Current usage metrics show cumulative count of Article Views (full-text article views including HTML views, PDF and ePub downloads, according to the available data) and Abstracts Views on Vision4Press platform.
Data correspond to usage on the plateform after 2015. The current usage metrics is available 48-96 hours after online publication and is updated daily on week days.
Initial download of the metrics may take a while.