Fig. 2.
Download original image
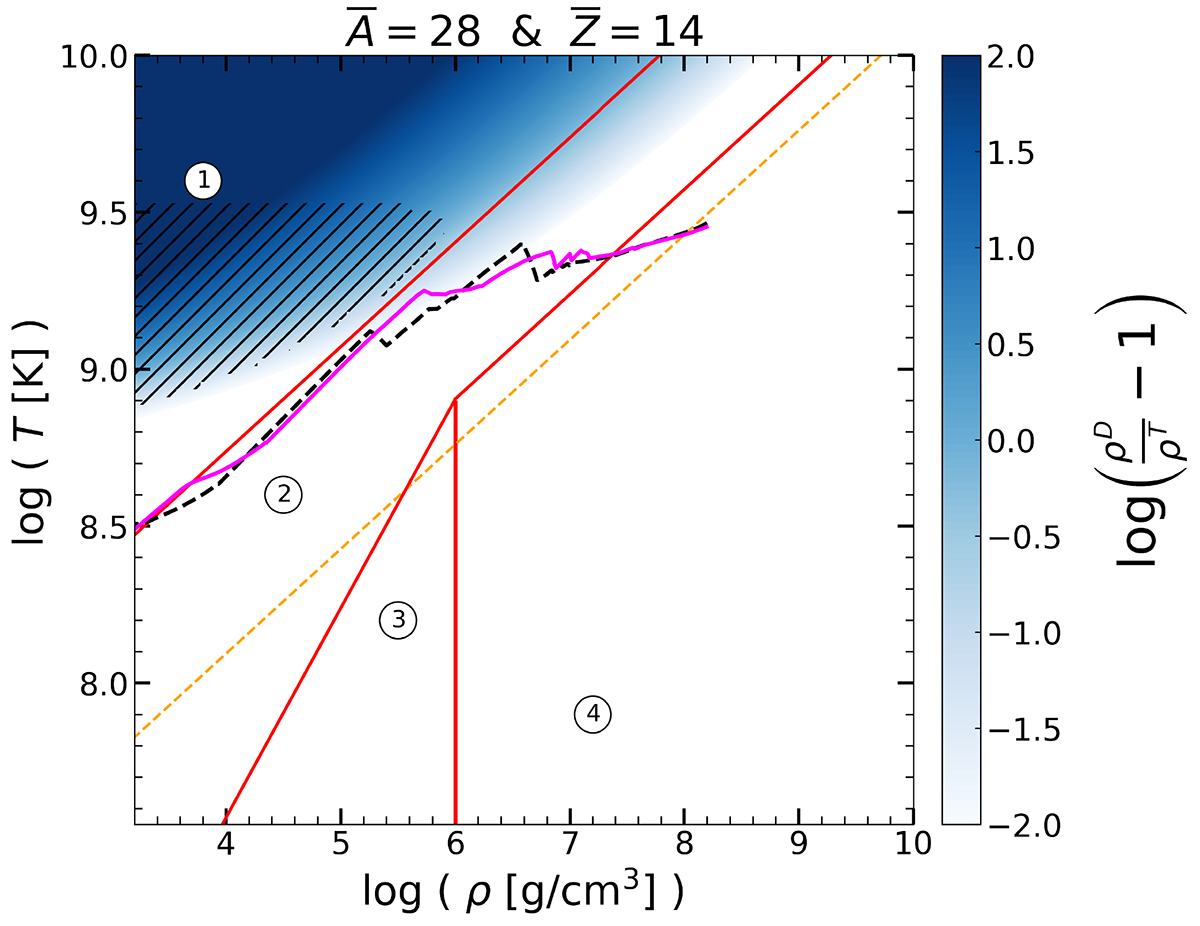
Comparison of the density from T-EoS, ρT, and the output density computed with the D-EoS, ρD. The composition used is that of pure silicon, ![]() and
and ![]() . White regions denote that ρD is very close to ρT. Blue regions indicate that ρD ≫ ρT. Shown are the same numbered zones as in Fig. 1 and the same hatched region. In dashed black is the internal (ρ(r),T(r)) structure of a 15 M⊙ model at the onset of silicon core burning, computed using the DT-EoS and in magenta the same model using the D-EoS.
. White regions denote that ρD is very close to ρT. Blue regions indicate that ρD ≫ ρT. Shown are the same numbered zones as in Fig. 1 and the same hatched region. In dashed black is the internal (ρ(r),T(r)) structure of a 15 M⊙ model at the onset of silicon core burning, computed using the DT-EoS and in magenta the same model using the D-EoS.
Current usage metrics show cumulative count of Article Views (full-text article views including HTML views, PDF and ePub downloads, according to the available data) and Abstracts Views on Vision4Press platform.
Data correspond to usage on the plateform after 2015. The current usage metrics is available 48-96 hours after online publication and is updated daily on week days.
Initial download of the metrics may take a while.