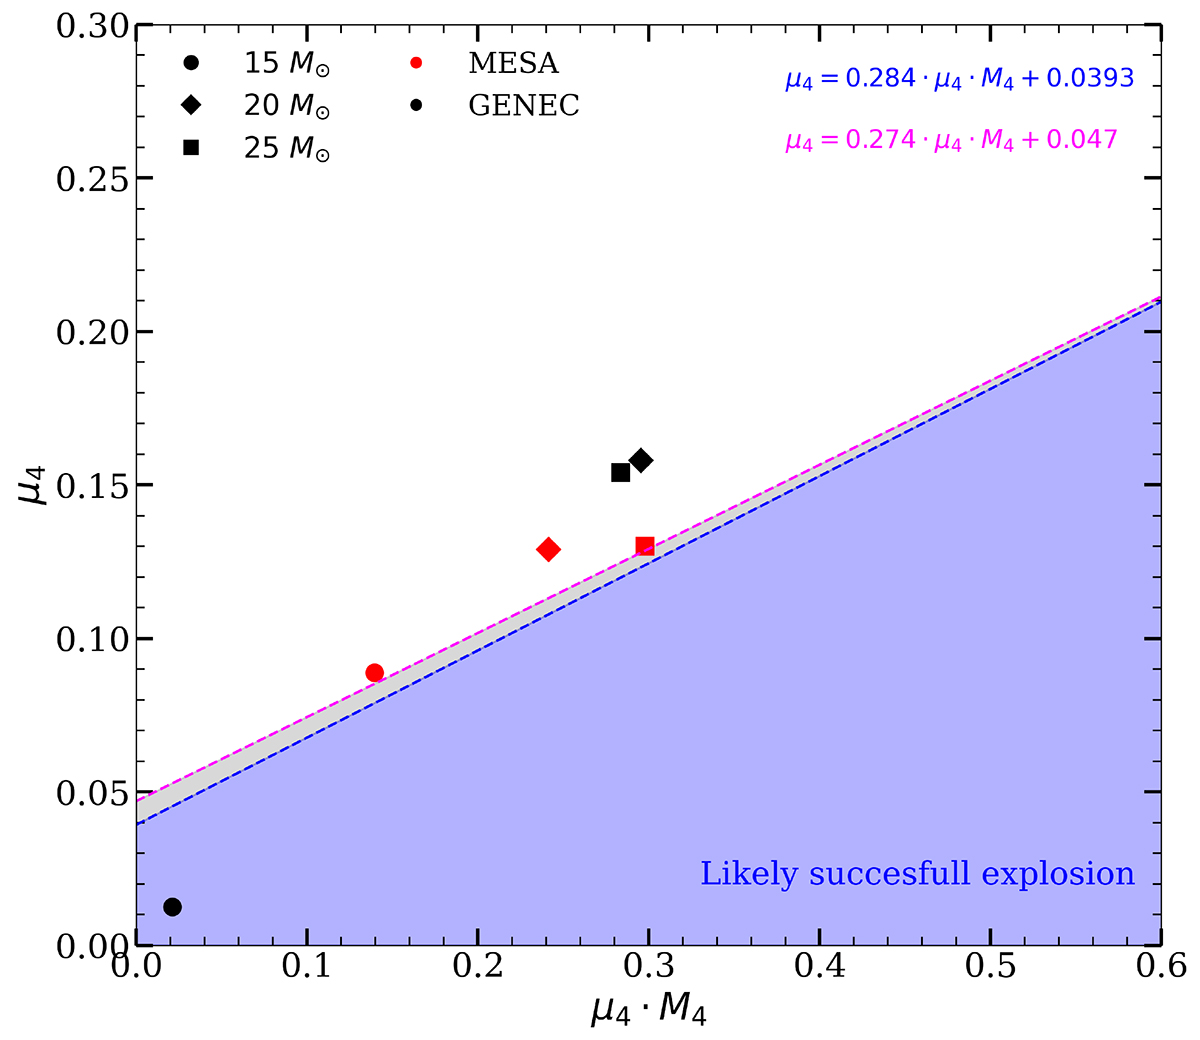
Fig. 14.
Download original image
Position for the pre-supernova models in the (M4 ⋅ μ4, μ4) plane. The blue and magenta lines are separating likely explosions (below the line) and likely black hole formation (above the line). The parametric lines are taken from Ertl et al. (2016). The blue line corresponds to the calibration using the s19.8 model (Eq. (27)) and the magenta line to the w20 model (Eq. (28)).
Current usage metrics show cumulative count of Article Views (full-text article views including HTML views, PDF and ePub downloads, according to the available data) and Abstracts Views on Vision4Press platform.
Data correspond to usage on the plateform after 2015. The current usage metrics is available 48-96 hours after online publication and is updated daily on week days.
Initial download of the metrics may take a while.