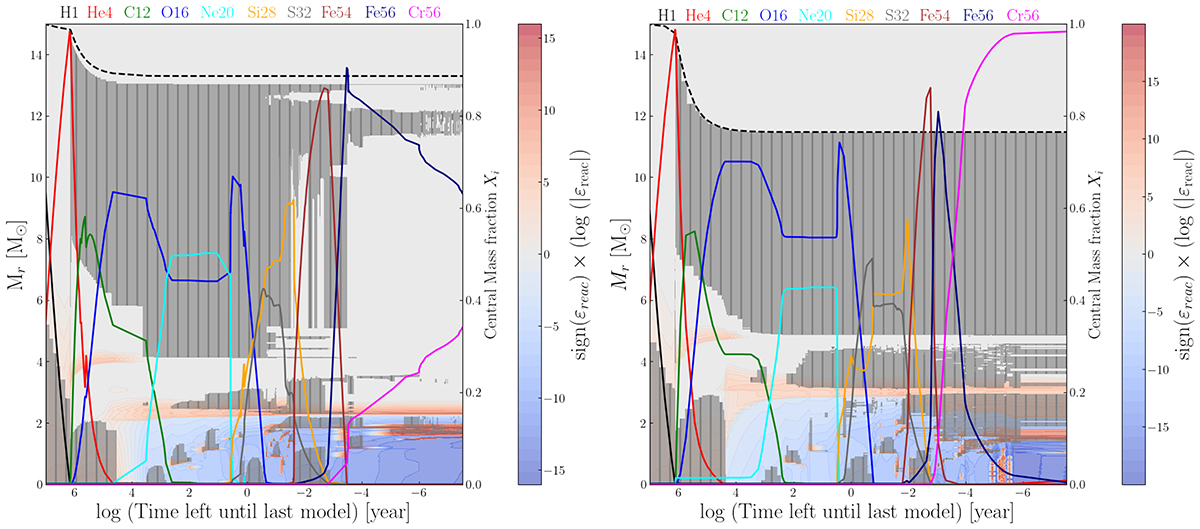
Fig. 12.
Download original image
Space-time diagrams, or Kippenhahn diagrams, of the 15 M⊙ model for GENEC (left) and MESA (right). The grey zones show convective regions. The plot background shade displays the total energy input, the nuclear energy subtracted by the loss of thermal neutrinos in log scale. Blue represents negative energy contributions and red positive contributions. On the right axis is shown the central abundance of a given selection of species to help identify the various burning phases. The black dashed line delimits the total mass of the model.
Current usage metrics show cumulative count of Article Views (full-text article views including HTML views, PDF and ePub downloads, according to the available data) and Abstracts Views on Vision4Press platform.
Data correspond to usage on the plateform after 2015. The current usage metrics is available 48-96 hours after online publication and is updated daily on week days.
Initial download of the metrics may take a while.