Fig. 1.
Download original image
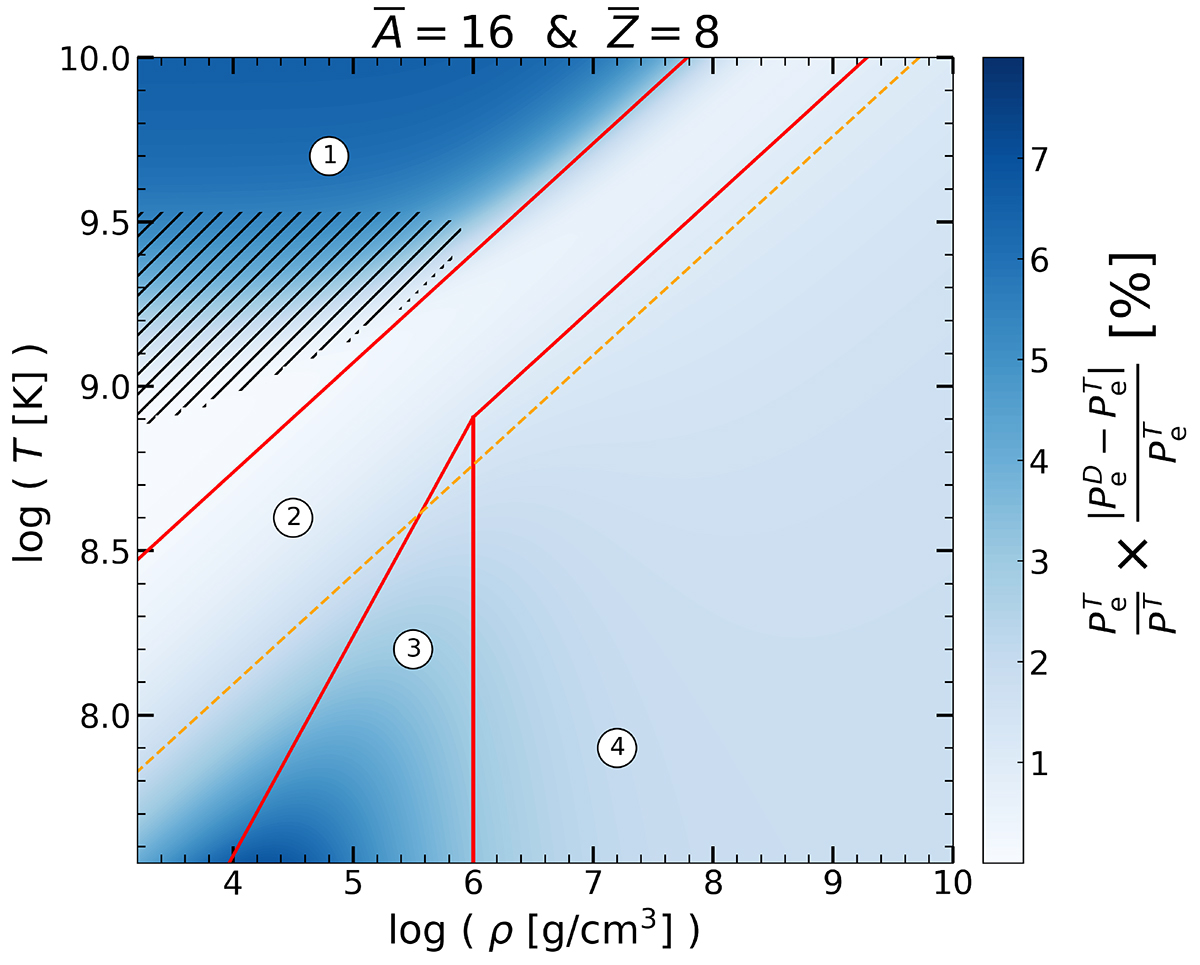
Variation between the lepton pressure computed using the D-EoS with that computed by the T-EoS. The EoSs are evaluated for a pure 16O composition, ![]() and
and ![]() . We also highlight four different regions separated by the red lines. Zone &#Xtextcircled;1 corresponds to the region where the total pressure is dominated by radiation pressure. In zone &#Xtextcircled;2 perfect gas pressure is dominant. Zone &#Xtextcircled;3 is dominated by non-relativistic degenerate electron pressure. Zone &#Xtextcircled;4 marks the limit where the electrons become relativistic. The region where
. We also highlight four different regions separated by the red lines. Zone &#Xtextcircled;1 corresponds to the region where the total pressure is dominated by radiation pressure. In zone &#Xtextcircled;2 perfect gas pressure is dominant. Zone &#Xtextcircled;3 is dominated by non-relativistic degenerate electron pressure. Zone &#Xtextcircled;4 marks the limit where the electrons become relativistic. The region where ![]() is black-hashed. Finally the orange dashed line corresponds to the relation
is black-hashed. Finally the orange dashed line corresponds to the relation ![]() , below which ΓC ≤ 1 (Eq. (5)) and Coulomb corrections to the EoS are important.
, below which ΓC ≤ 1 (Eq. (5)) and Coulomb corrections to the EoS are important.
Current usage metrics show cumulative count of Article Views (full-text article views including HTML views, PDF and ePub downloads, according to the available data) and Abstracts Views on Vision4Press platform.
Data correspond to usage on the plateform after 2015. The current usage metrics is available 48-96 hours after online publication and is updated daily on week days.
Initial download of the metrics may take a while.