Fig. 6.
Download original image
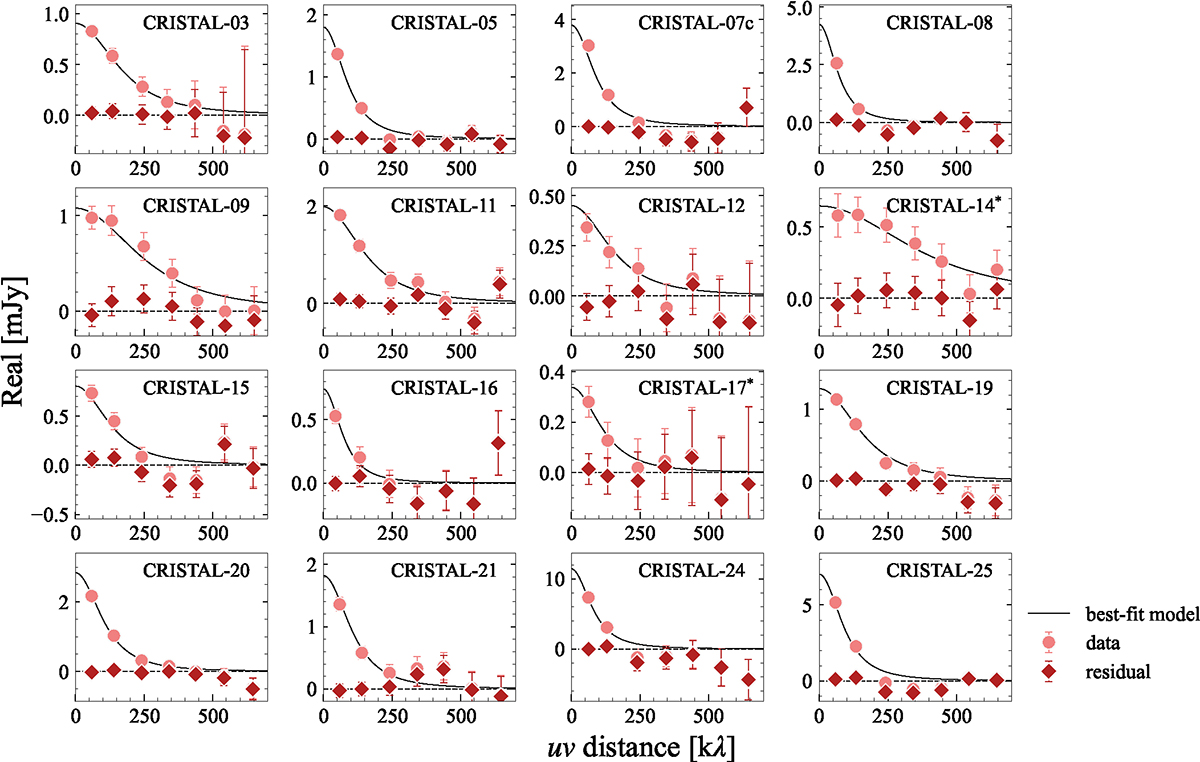
Flux density in the form of the real part of the visibility, as a function of uv distances along the minor axis. Each data point represents the mean value per 100 kλ bin. The galaxies that were fit in a circular exponential disk model are marked in an asterisk. The uncertainties represent the standard deviation. Both the data (circle) and the residual (diamond) visibilities are shown. The residuals are created by subtracting the best-fit model (solid black line) from the data.
Current usage metrics show cumulative count of Article Views (full-text article views including HTML views, PDF and ePub downloads, according to the available data) and Abstracts Views on Vision4Press platform.
Data correspond to usage on the plateform after 2015. The current usage metrics is available 48-96 hours after online publication and is updated daily on week days.
Initial download of the metrics may take a while.