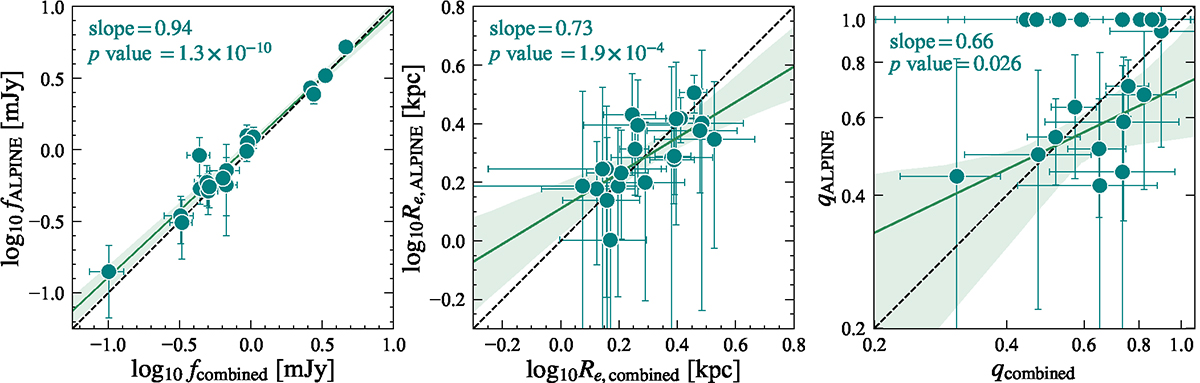
Fig. C.1.
Download original image
Comparison of total flux (left), effective radius (middle), and axis ratio (right) measured from the visibility modeling using different datasets. A slope and p value based on a linear regression fitting are shown in the top-left corner of each panel. We exclude the galaxies with qALPINE = 1 for the fitting of minor-to-major axis ratio.
Current usage metrics show cumulative count of Article Views (full-text article views including HTML views, PDF and ePub downloads, according to the available data) and Abstracts Views on Vision4Press platform.
Data correspond to usage on the plateform after 2015. The current usage metrics is available 48-96 hours after online publication and is updated daily on week days.
Initial download of the metrics may take a while.