Fig. 1.
Download original image
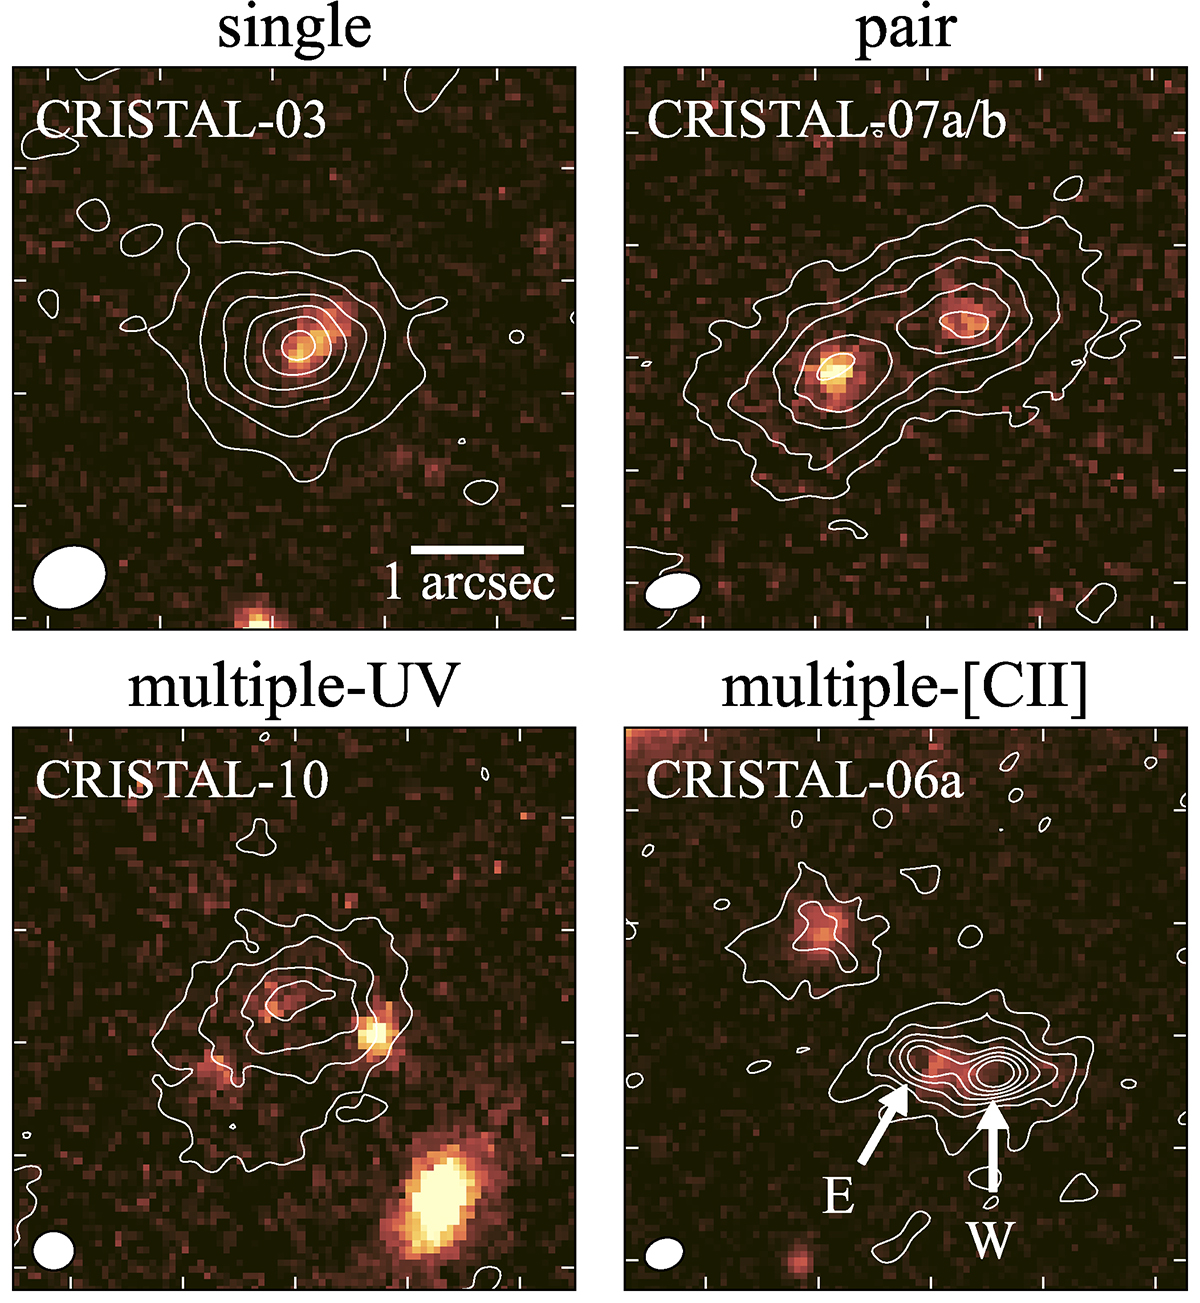
Classification of the galaxies based on a multiplicity of [C II] line (with contours) and rest-frame UV (background, HST/WFC3 F160W) emission. A 5″ × 5″ region is shown in each panel. The contours start at 2σ and increase in steps of 3σ until 20σ. The Gaussian FWHM fit from the synthesized dirty beam is shown as a white ellipse in the lower-left corner of each panel3. Two arrows shown in a panel of multiple-[C II] (CRISTAL-06a) correspond to two [C II] line components (denoted as ‘W’ and ‘E’) that are visually identified.
Current usage metrics show cumulative count of Article Views (full-text article views including HTML views, PDF and ePub downloads, according to the available data) and Abstracts Views on Vision4Press platform.
Data correspond to usage on the plateform after 2015. The current usage metrics is available 48-96 hours after online publication and is updated daily on week days.
Initial download of the metrics may take a while.