Fig. 8
Download original image
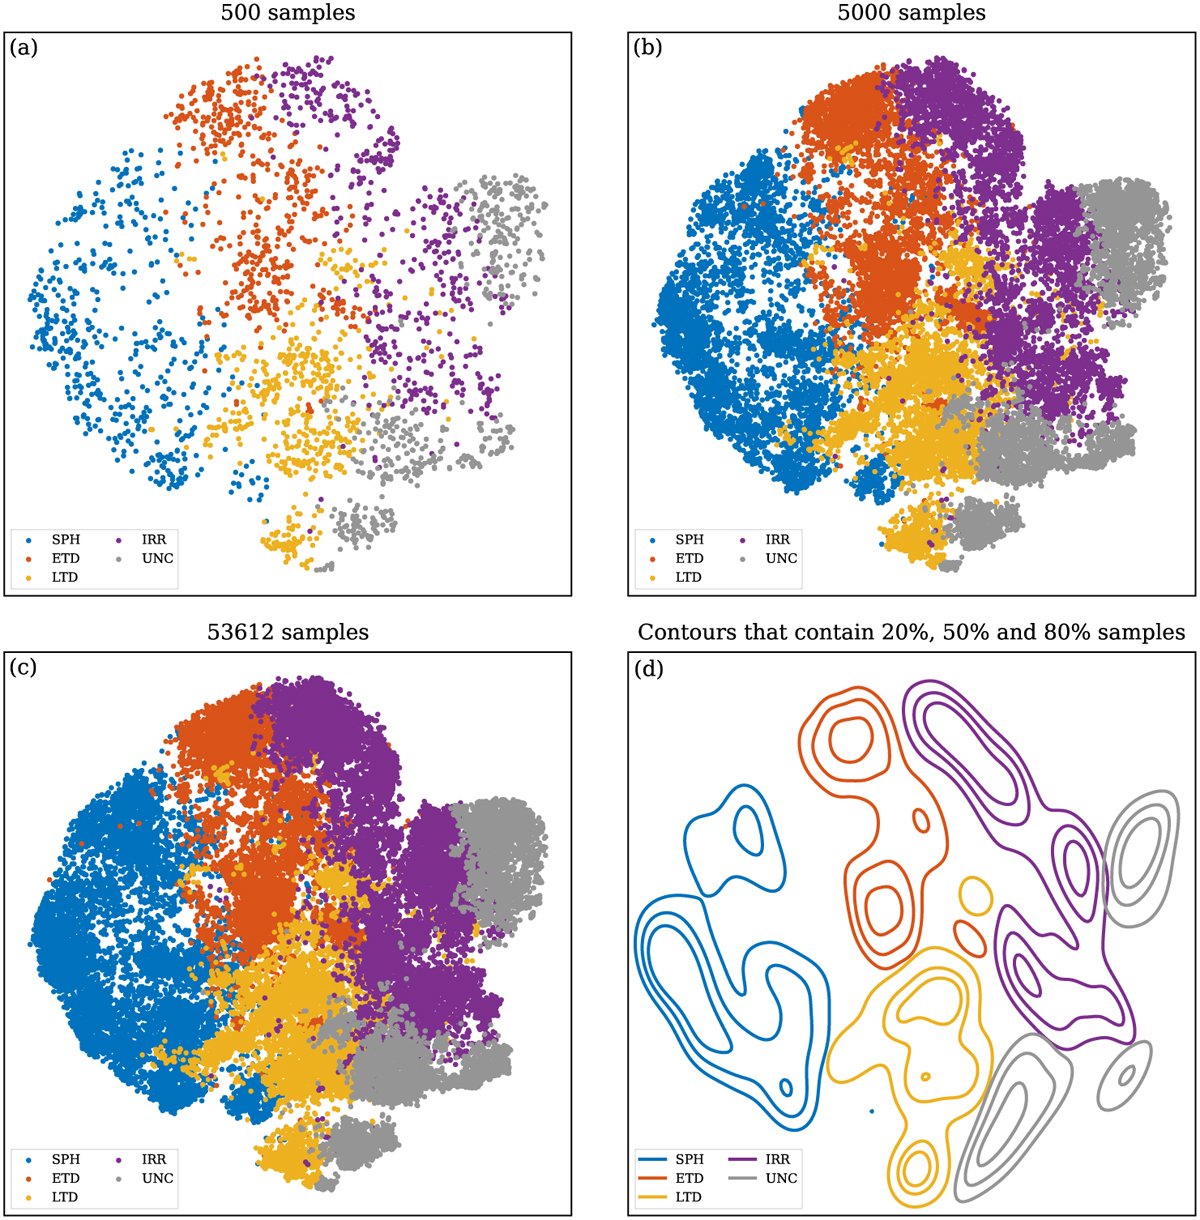
t-SNE display of the final classification result. We use the t-SNE dimensionality reduction technique to perform two-dimensional mapping on the final classified 5 types of galaxies. Panels a–c respectively display the dimensionality reduction results of randomly selected 500, 5000, and all samples. Panel d represents the contours that contain 20, 50, and 80% of the well-classified samples, respectively.
Current usage metrics show cumulative count of Article Views (full-text article views including HTML views, PDF and ePub downloads, according to the available data) and Abstracts Views on Vision4Press platform.
Data correspond to usage on the plateform after 2015. The current usage metrics is available 48-96 hours after online publication and is updated daily on week days.
Initial download of the metrics may take a while.