Fig. 12
Download original image
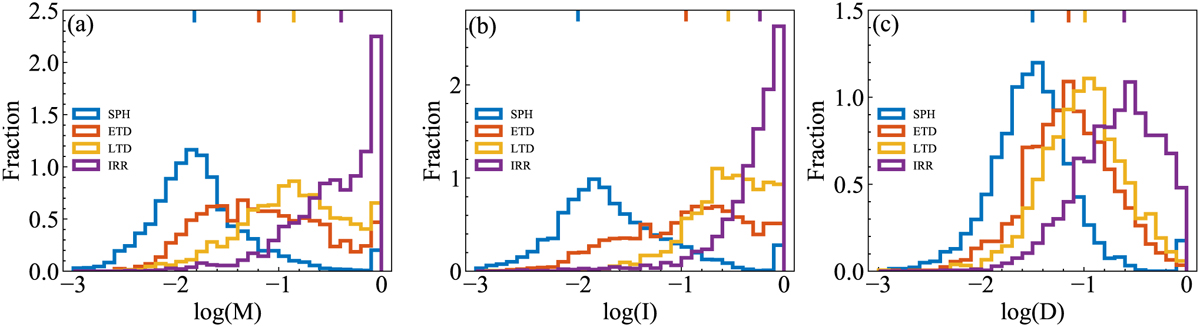
Distribution ofM (left), I (middle), and D (right) for different types of massive galaxies. The bars at the top represent the median values of M, I, and D for different galaxy types. It is evident that from SPHs to IRRs, the I of galaxies gradually increases, and the D also gradually increases. There are significant differences in the M, I, and D parameters among different categories of galaxies, which indirectly proves the effectiveness of our classification. (SPH: blue, ETD: orange, LTD: yellow, IRR: purple).
Current usage metrics show cumulative count of Article Views (full-text article views including HTML views, PDF and ePub downloads, according to the available data) and Abstracts Views on Vision4Press platform.
Data correspond to usage on the plateform after 2015. The current usage metrics is available 48-96 hours after online publication and is updated daily on week days.
Initial download of the metrics may take a while.