Open Access
Fig. 11
Download original image
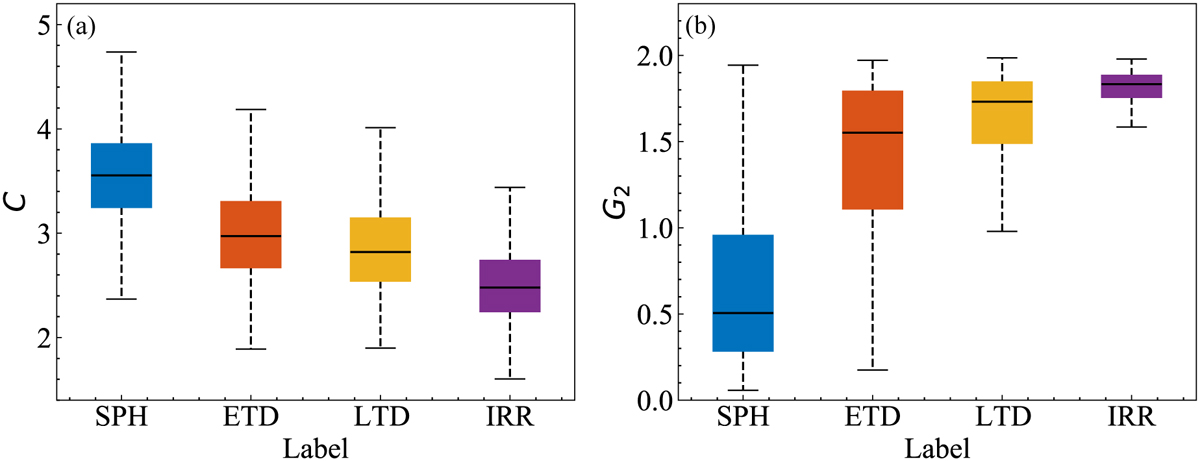
Similar to Fig. 9 but for C (left) and G2 (right) It is evident that from SPHs to IRRs, the C of galaxies gradually decreases, while the G2 gradually increases. Different types of galaxies have significantly different parameter distributions.
Current usage metrics show cumulative count of Article Views (full-text article views including HTML views, PDF and ePub downloads, according to the available data) and Abstracts Views on Vision4Press platform.
Data correspond to usage on the plateform after 2015. The current usage metrics is available 48-96 hours after online publication and is updated daily on week days.
Initial download of the metrics may take a while.