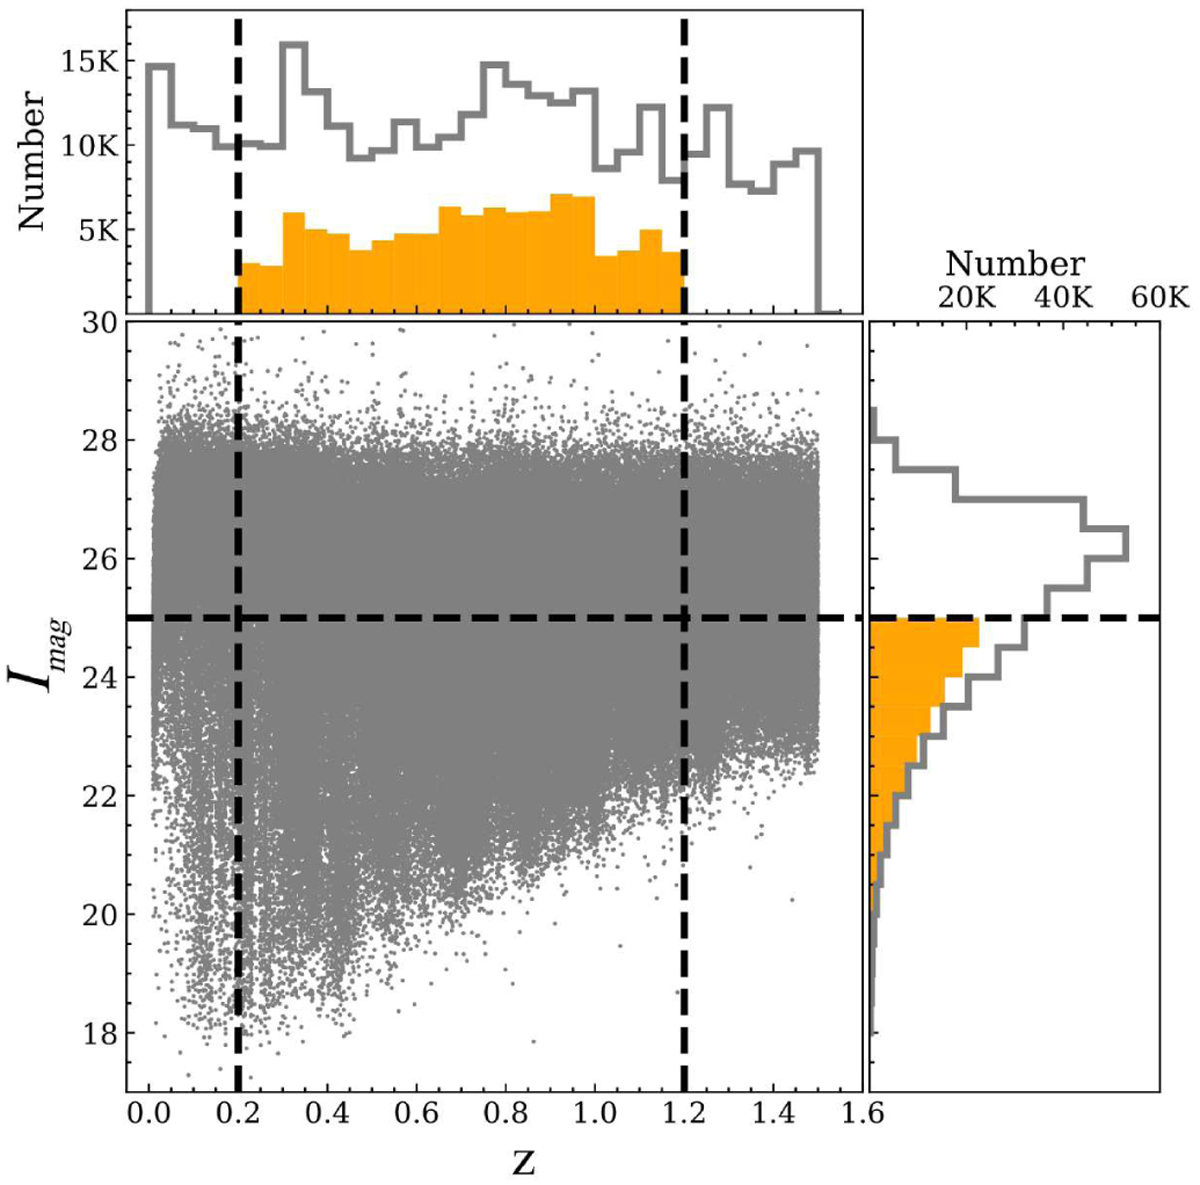
Fig. 1
Download original image
Distribution of our sample in the I-band magnitude versus red-shift diagram. The grey points represent the distribution of all galaxy samples in the COSMOS2020 Catalogue. In this work, we only consider samples with Imag < 25 and within the redshift range of 0.2 < ɀ < 1.2. In the panels above and to the right of the image, the grey solid lines (yellow bars) show the distributions of Imag and z for all galaxy samples (the sample we selected) in the COSMOS2020 catalog.
Current usage metrics show cumulative count of Article Views (full-text article views including HTML views, PDF and ePub downloads, according to the available data) and Abstracts Views on Vision4Press platform.
Data correspond to usage on the plateform after 2015. The current usage metrics is available 48-96 hours after online publication and is updated daily on week days.
Initial download of the metrics may take a while.