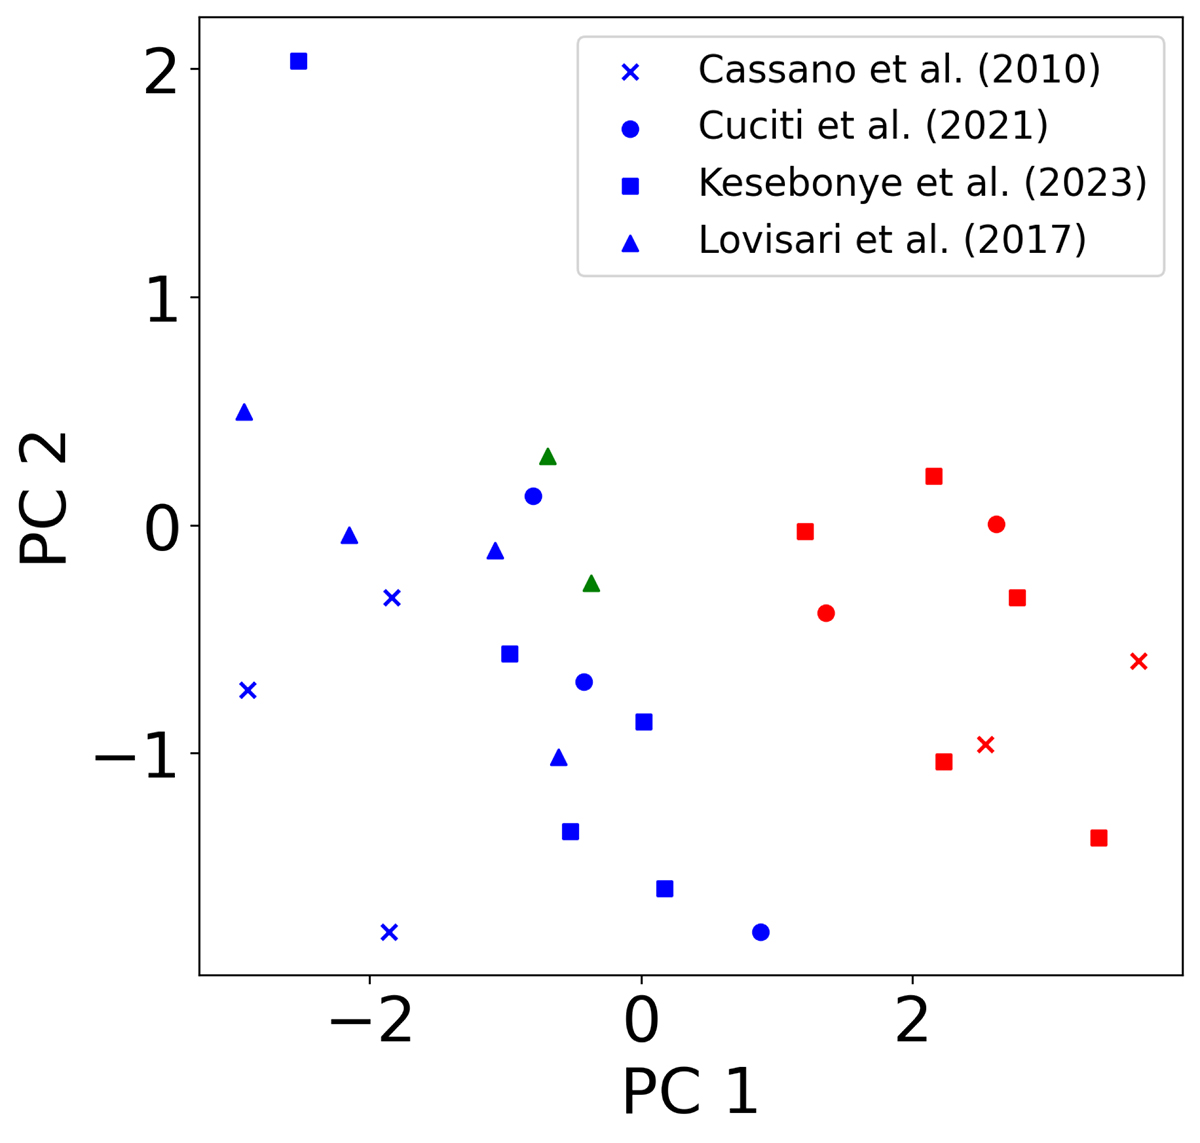
Fig. 7.
Download original image
Parameter space of the first two principal components (PC 1 and PC 2) obtained from the six dynamic parameters described in Section 5 for the 26 clusters in the sample that have a well-defined dynamical state in the literature. Blue, red, and green symbols represent relaxed, disturbed, and intermediate clusters, respectively. Crosses, dots, squares and triangles correspond to the data extracted from Cassano et al. (2010), Cuciti et al. (2021), Kesebonye et al. (2023), and Lovisari et al. (2017), respectively.
Current usage metrics show cumulative count of Article Views (full-text article views including HTML views, PDF and ePub downloads, according to the available data) and Abstracts Views on Vision4Press platform.
Data correspond to usage on the plateform after 2015. The current usage metrics is available 48-96 hours after online publication and is updated daily on week days.
Initial download of the metrics may take a while.