Fig. 6.
Download original image
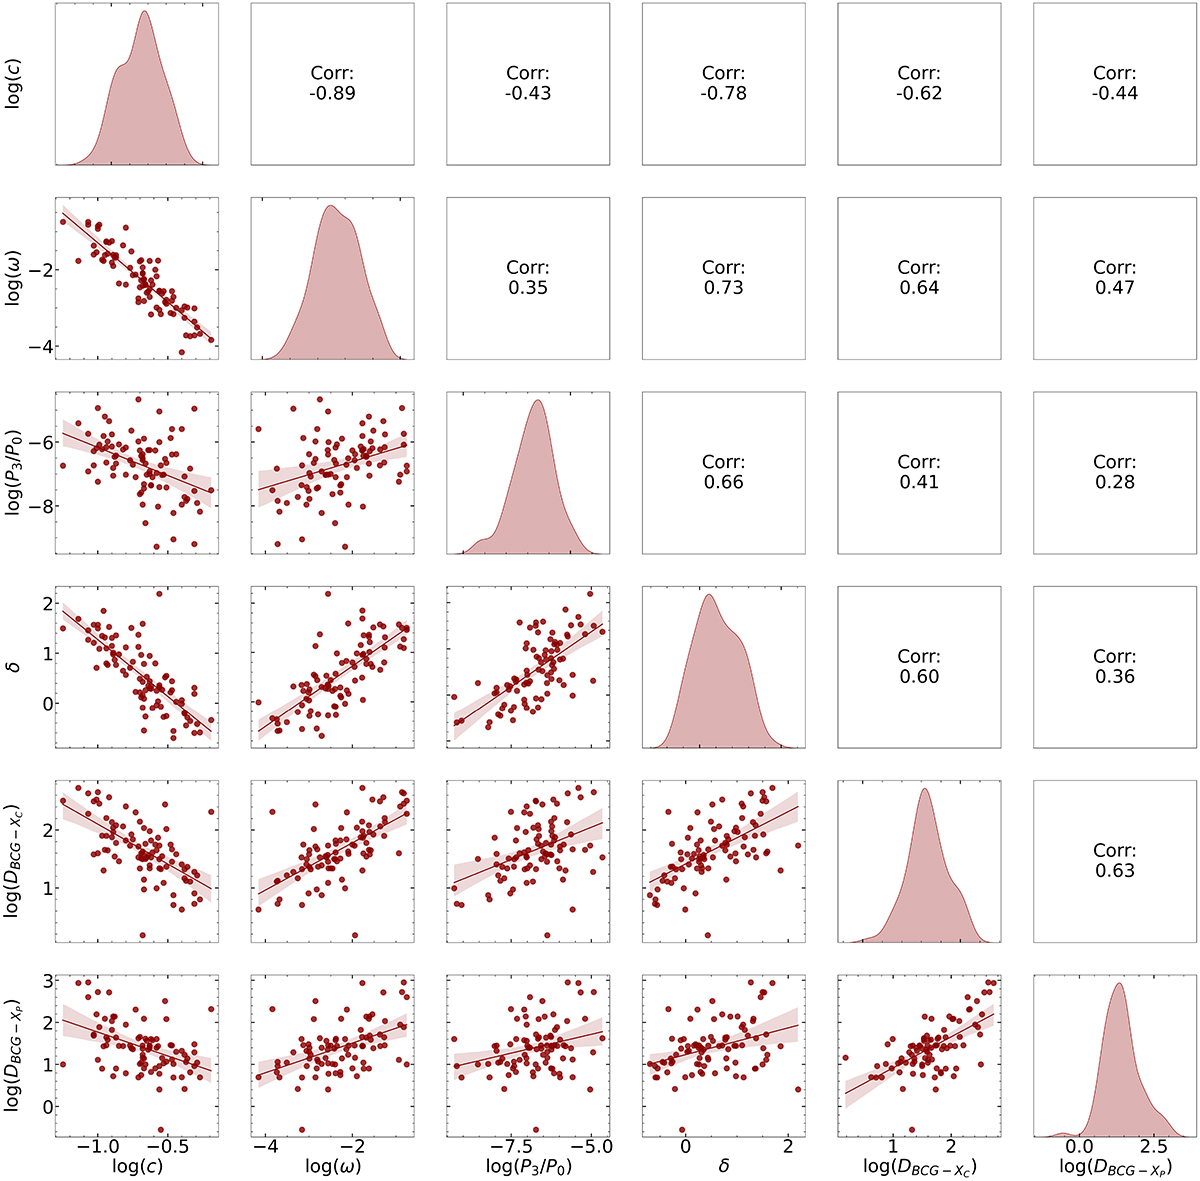
Correlation matrix of the six dynamical state proxies used in this work. The diagonal displays the kernel density estimation (KDE) of each variable. Below the diagonal, scatter plots with linear fits and their corresponding confidence intervals are presented for all combinations of these parameters. Above the diagonal, the Pearson correlation coefficients associated with each parameter space are shown.
Current usage metrics show cumulative count of Article Views (full-text article views including HTML views, PDF and ePub downloads, according to the available data) and Abstracts Views on Vision4Press platform.
Data correspond to usage on the plateform after 2015. The current usage metrics is available 48-96 hours after online publication and is updated daily on week days.
Initial download of the metrics may take a while.