Fig. 5.
Download original image
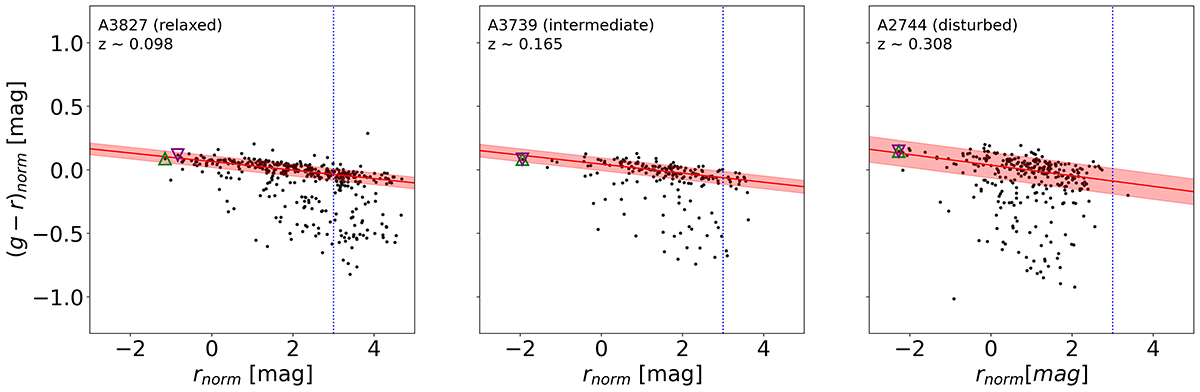
Normalized color-magnitude diagrams for the same clusters mentioned in Fig. 4. Black dots correspond to galaxies selected as members using the probabilistic method with photometric redshifts. Green triangles represent galaxies pre-selected as BCGs using the automated method, while purple inverted triangles denote visually confirmed BCGs. The solid red lines represent the best fits of the red sequences calculated with HuberRegressor and the red shaded areas are the 1σ regions of them. The vertical blue dashed lines indicate the magnitude limit for studying physical and structural properties, namely, m* + 3, where m* is the characteristic magnitude at each cluster redshift modeled with CPS.
Current usage metrics show cumulative count of Article Views (full-text article views including HTML views, PDF and ePub downloads, according to the available data) and Abstracts Views on Vision4Press platform.
Data correspond to usage on the plateform after 2015. The current usage metrics is available 48-96 hours after online publication and is updated daily on week days.
Initial download of the metrics may take a while.