Fig. 4.
Download original image
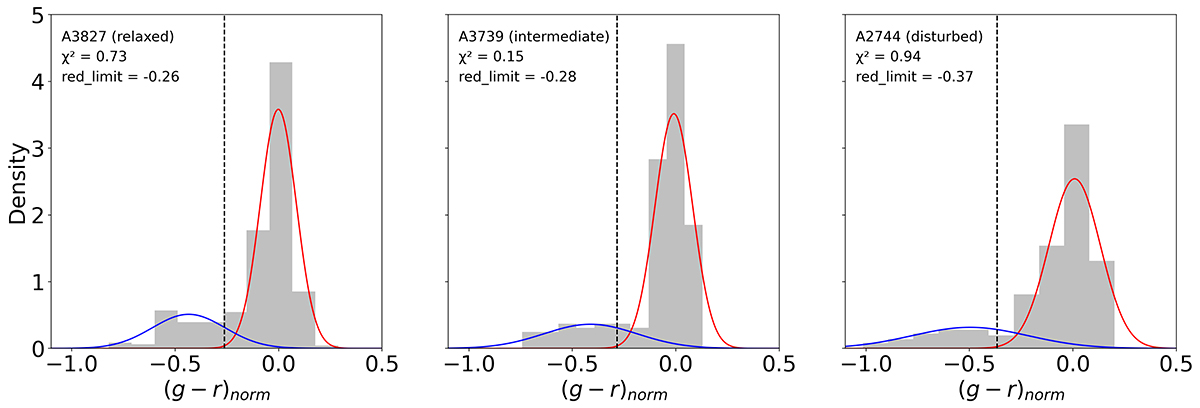
Double Gaussian fits applied to the normalized color distribution of each cluster. From left to right panels, Abell 3827 (relaxed cluster), Abell 3739 (intermediate cluster), and Abell 2744 (disturbed cluster) are presented as examples. The colors of the Gaussians are associated with the red and blue components of the galaxy clusters. The black dashed line indicated the red_limit in each panel. The specific value of this parameter is located in the upper left corner of each panel along with the χ2 statistic for each fit performed with LMFIT.
Current usage metrics show cumulative count of Article Views (full-text article views including HTML views, PDF and ePub downloads, according to the available data) and Abstracts Views on Vision4Press platform.
Data correspond to usage on the plateform after 2015. The current usage metrics is available 48-96 hours after online publication and is updated daily on week days.
Initial download of the metrics may take a while.