Open Access
Fig. 3.
Download original image
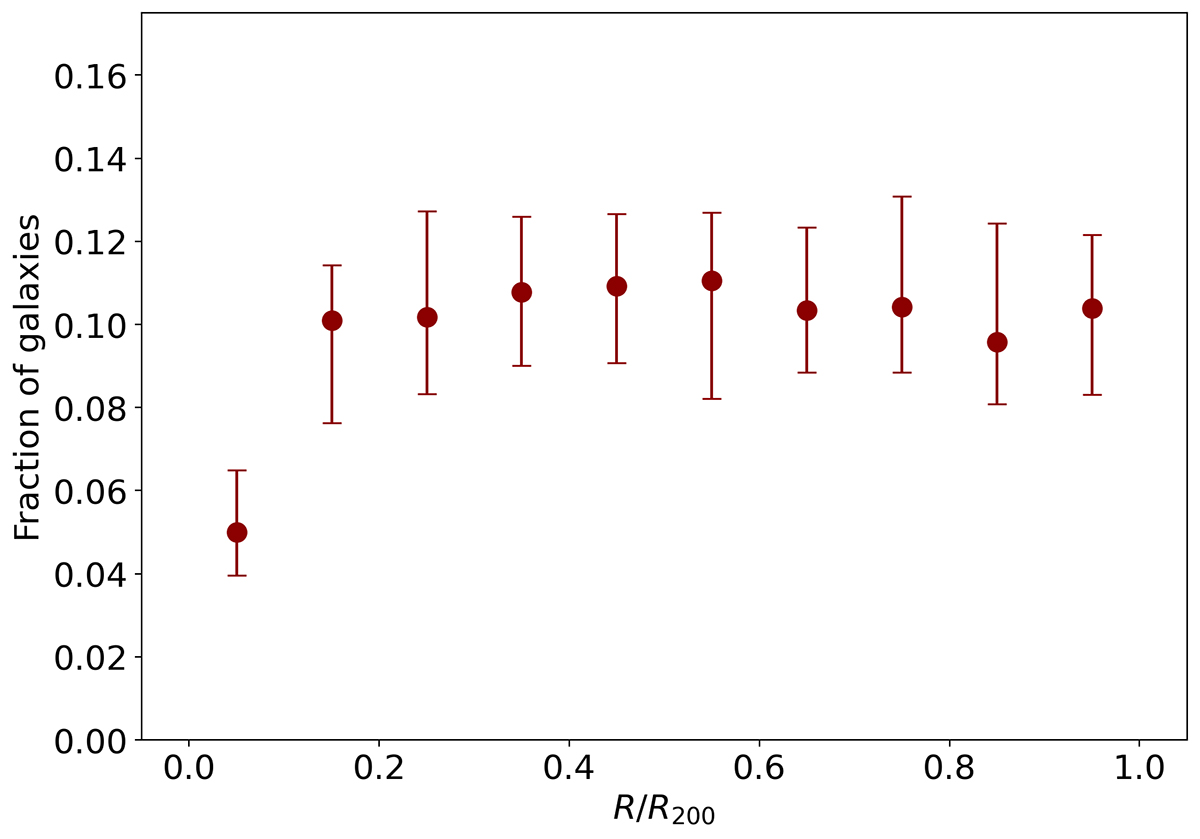
Fraction of galaxies as function of the clustercentric distance for the stacked sample of galaxy clusters. Dark red points correspond to the median values in each bin, while the lower and upper error bars are the first and third quartile in each bin, respectively.
Current usage metrics show cumulative count of Article Views (full-text article views including HTML views, PDF and ePub downloads, according to the available data) and Abstracts Views on Vision4Press platform.
Data correspond to usage on the plateform after 2015. The current usage metrics is available 48-96 hours after online publication and is updated daily on week days.
Initial download of the metrics may take a while.