Open Access
Fig. B.1.
Download original image
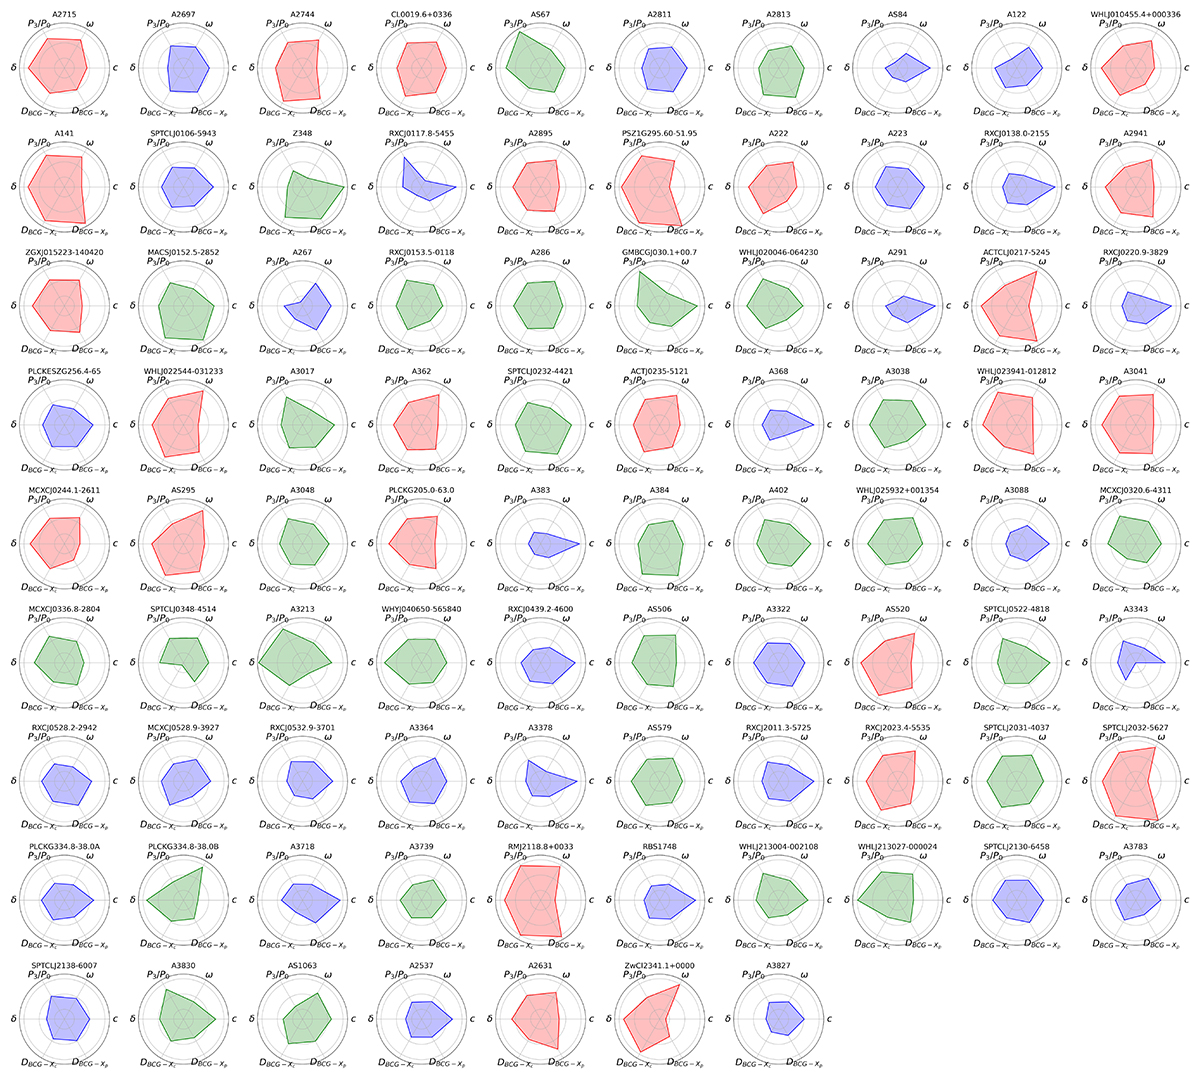
Radar charts with the six dynamical parameters used in this work for all clusters in the sample. The colors blue, green, and red indicate the relaxed, intermediate, and disturbed dynamical states, respectively. The parameter values are scaled in the same way as in Fig. 9.
Current usage metrics show cumulative count of Article Views (full-text article views including HTML views, PDF and ePub downloads, according to the available data) and Abstracts Views on Vision4Press platform.
Data correspond to usage on the plateform after 2015. The current usage metrics is available 48-96 hours after online publication and is updated daily on week days.
Initial download of the metrics may take a while.