Fig. 10.
Download original image
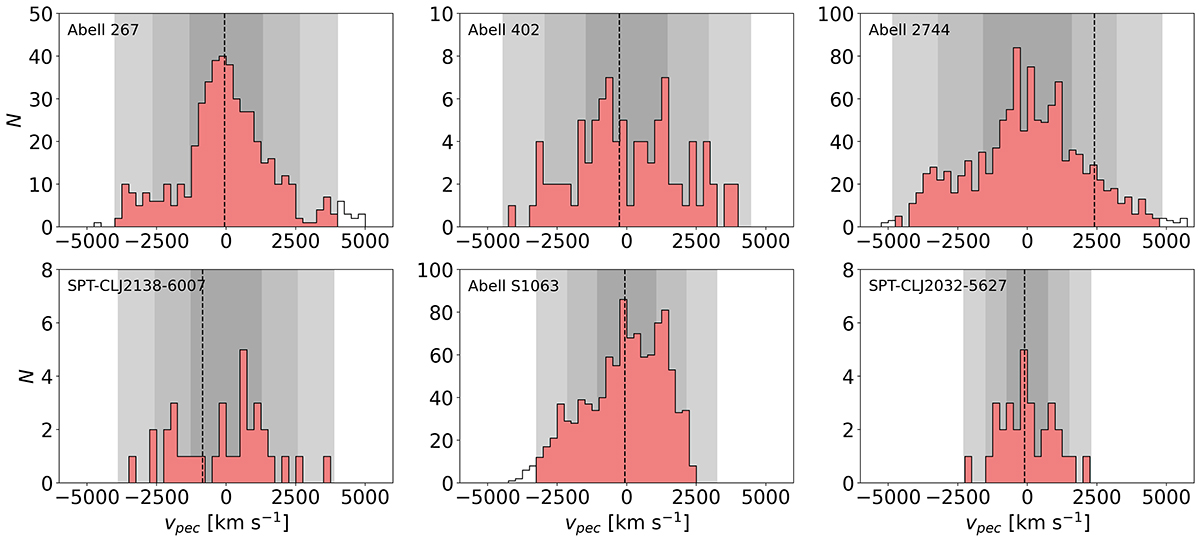
Peculiar velocity distributions of galaxies within 6000 km s−1 of six example galaxy clusters. The members are marked with red bars. The black dashed lines indicate the positions of the BCGs selected by visual inspection. The shaded areas represent the 1σ, 2σ, and 3σ regions from darkest to lightest. The cluster names are indicated in the upper left corners of each panel. The bin sizes are 250 km s−1.
Current usage metrics show cumulative count of Article Views (full-text article views including HTML views, PDF and ePub downloads, according to the available data) and Abstracts Views on Vision4Press platform.
Data correspond to usage on the plateform after 2015. The current usage metrics is available 48-96 hours after online publication and is updated daily on week days.
Initial download of the metrics may take a while.