Fig. 8.
Download original image
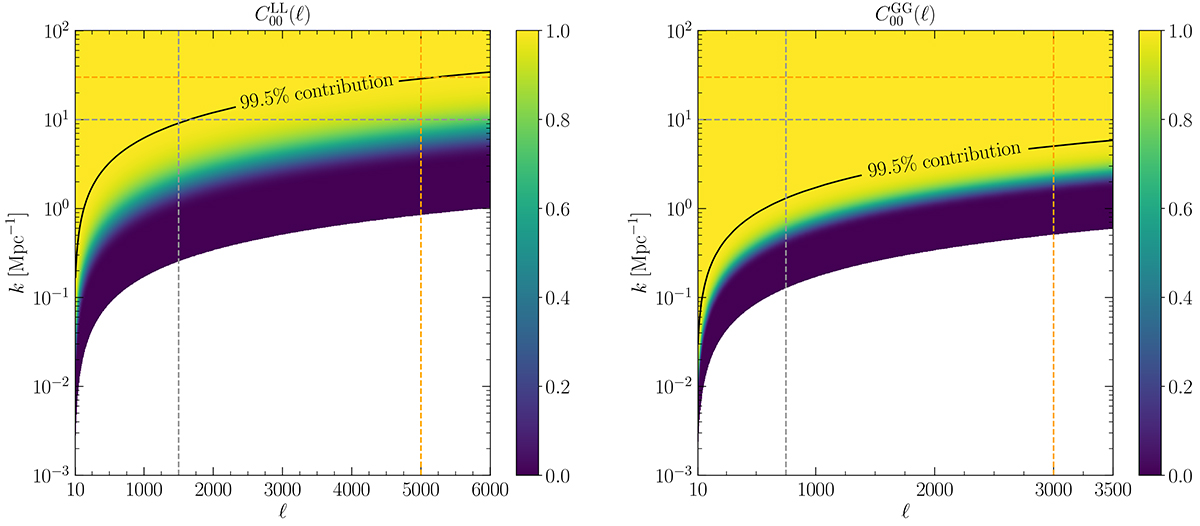
Cumulative contribution of different k values to ![]() for a given ℓ in the nearest redshift bin (ij = 00). Left: Case of WL, XY = LL. Right: Case of GC, XY = GG. For each ℓ, 99.5% of the contribution stands below the black isocontour. In the pessimistic case, we include all values of (ℓ,k) on the left of and below the dashed grey lines in the calculation of our observables; in the optimistic case, on the left and below the dashed orange line. Thus, we always include at least 99.5% of the contribution to each
for a given ℓ in the nearest redshift bin (ij = 00). Left: Case of WL, XY = LL. Right: Case of GC, XY = GG. For each ℓ, 99.5% of the contribution stands below the black isocontour. In the pessimistic case, we include all values of (ℓ,k) on the left of and below the dashed grey lines in the calculation of our observables; in the optimistic case, on the left and below the dashed orange line. Thus, we always include at least 99.5% of the contribution to each ![]() .
.
Current usage metrics show cumulative count of Article Views (full-text article views including HTML views, PDF and ePub downloads, according to the available data) and Abstracts Views on Vision4Press platform.
Data correspond to usage on the plateform after 2015. The current usage metrics is available 48-96 hours after online publication and is updated daily on week days.
Initial download of the metrics may take a while.