Fig. 5.
Download original image
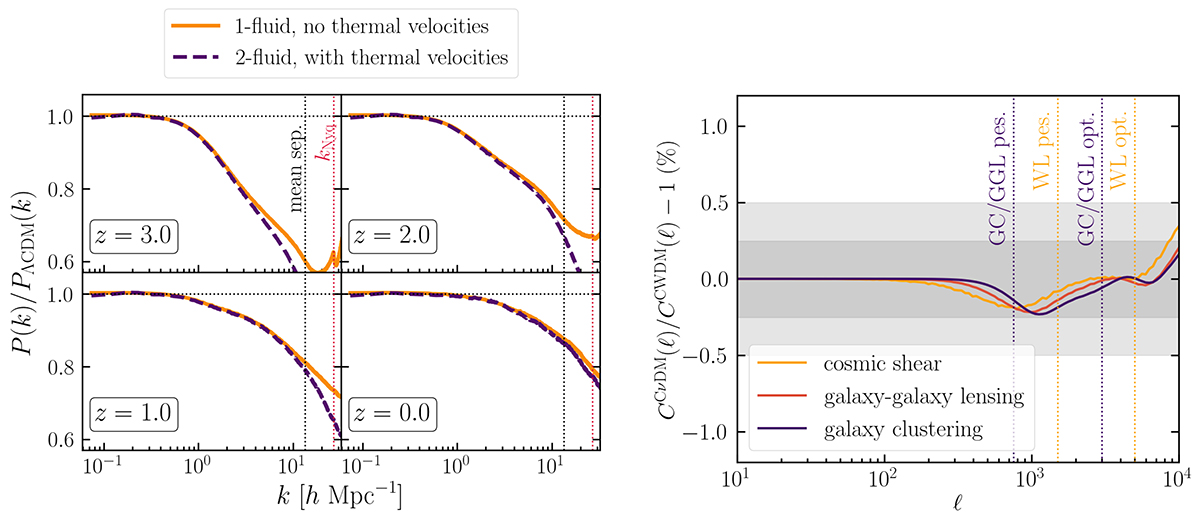
Left: Effect of neglecting the WDM thermal velocities in CWDM simulations with fwdm = 0.2 and ![]() . In each panel, solid orange lines represent the suppression in the non-linear matter power spectrum when neglecting WDM thermal velocities; dashed violet lines do the same when implementing WDM as a second fluid in the simulation, with its own thermal velocity field. We plot as vertical lines the mean interparticle separation in blue and the Nyquist frequency in red. Right: Ratio of angular power spectra C(ℓ) for cosmic shear (orange), the cross-correlation of GC and galaxy lensing (red), and GC (purple), defined in Eq. (30), and computed using either the power spectra that neglect or consider thermal velocities. These C(ℓ) are computed for simplicity in a single redshift bin ranging from z = 0 to 3.5 with the galaxy distribution of Eq. (34). We show the 0.25% and 0.5% regions as dark and light shaded areas. The maximum ℓ value corresponding to the optimistic and pessimistic settings for Euclid are drawn as vertical lines for each probe (cosmic shear or equivalently WL in dotted yellow, GC and cross-correlation in dotted violet).
. In each panel, solid orange lines represent the suppression in the non-linear matter power spectrum when neglecting WDM thermal velocities; dashed violet lines do the same when implementing WDM as a second fluid in the simulation, with its own thermal velocity field. We plot as vertical lines the mean interparticle separation in blue and the Nyquist frequency in red. Right: Ratio of angular power spectra C(ℓ) for cosmic shear (orange), the cross-correlation of GC and galaxy lensing (red), and GC (purple), defined in Eq. (30), and computed using either the power spectra that neglect or consider thermal velocities. These C(ℓ) are computed for simplicity in a single redshift bin ranging from z = 0 to 3.5 with the galaxy distribution of Eq. (34). We show the 0.25% and 0.5% regions as dark and light shaded areas. The maximum ℓ value corresponding to the optimistic and pessimistic settings for Euclid are drawn as vertical lines for each probe (cosmic shear or equivalently WL in dotted yellow, GC and cross-correlation in dotted violet).
Current usage metrics show cumulative count of Article Views (full-text article views including HTML views, PDF and ePub downloads, according to the available data) and Abstracts Views on Vision4Press platform.
Data correspond to usage on the plateform after 2015. The current usage metrics is available 48-96 hours after online publication and is updated daily on week days.
Initial download of the metrics may take a while.