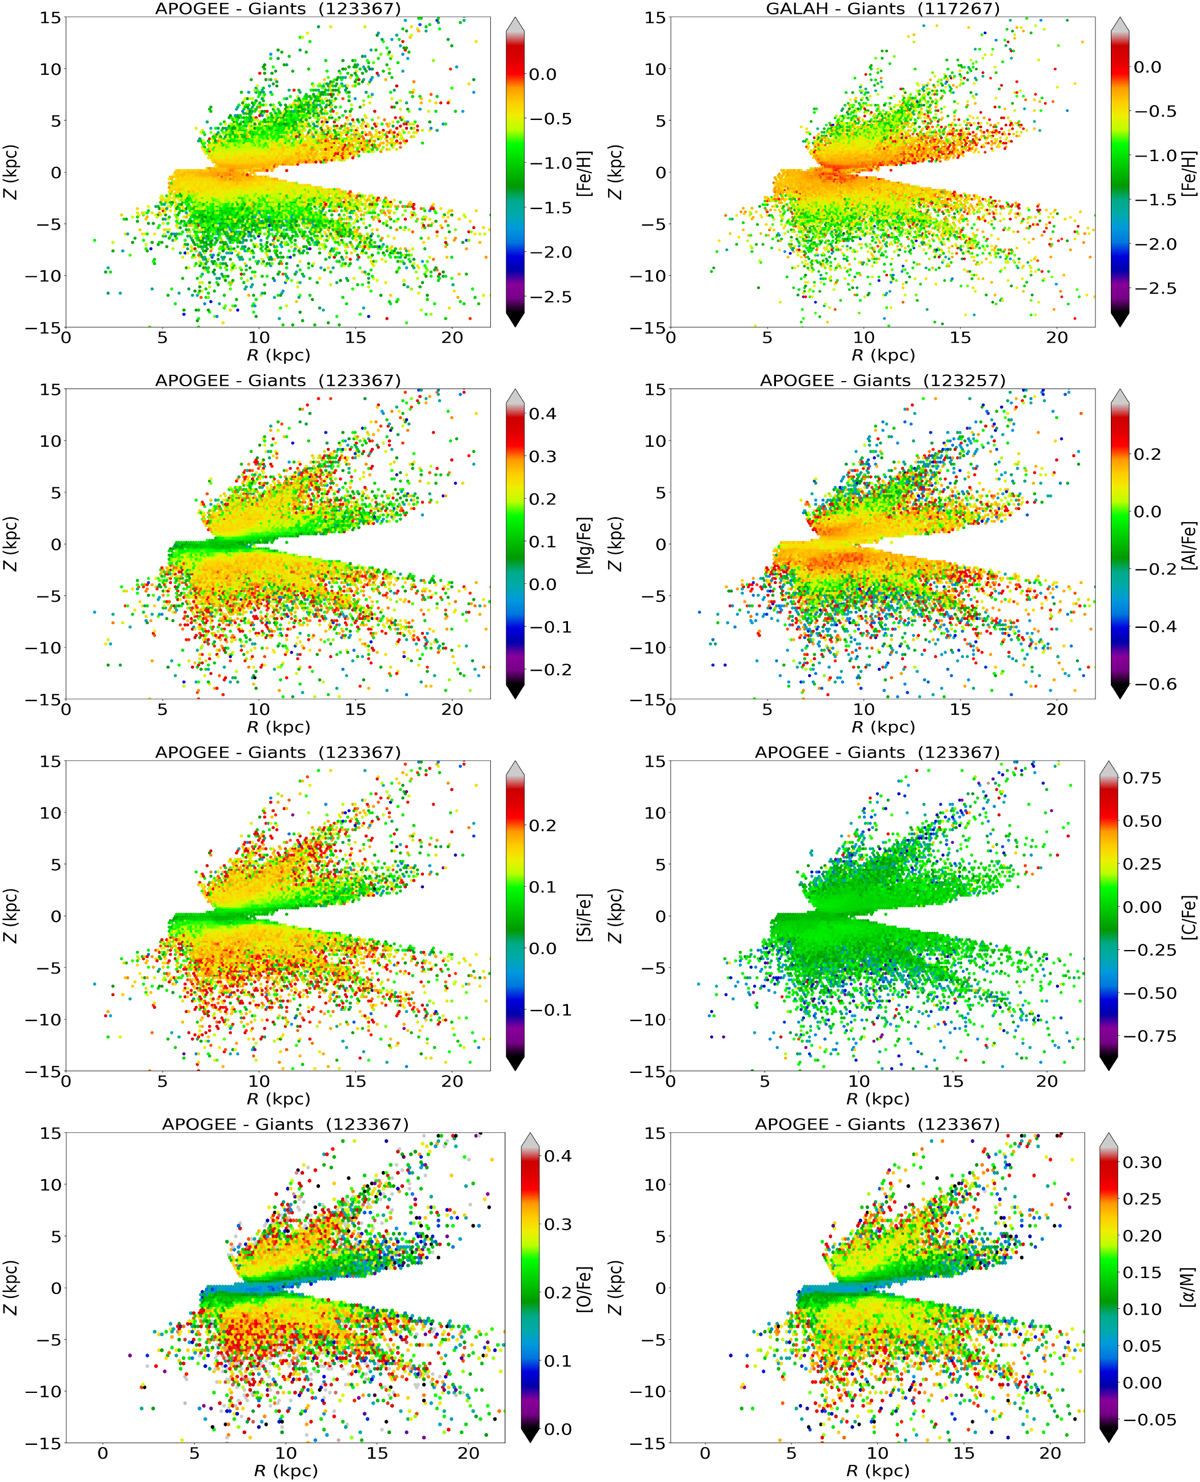
Fig. 9

Download original image
Spatial distribution of Milky Way giant stars and their various chemical abundances calculated in this study. In each plot, radial distance (R) in kpc from the center of the Milky Way is plotted along the abscissa, and the Galactic vertical height (z) is plotted along the ordinate. The colorbar represents the range of various calculated chemical abundances obtained in this work, illustrating how these abundances vary across different Galactic positions. The title of each plot indicates the training data set used to calculate the respective chemical abundance and the number of giant stars plotted.
Current usage metrics show cumulative count of Article Views (full-text article views including HTML views, PDF and ePub downloads, according to the available data) and Abstracts Views on Vision4Press platform.
Data correspond to usage on the plateform after 2015. The current usage metrics is available 48-96 hours after online publication and is updated daily on week days.
Initial download of the metrics may take a while.


