Fig. 14
Download original image
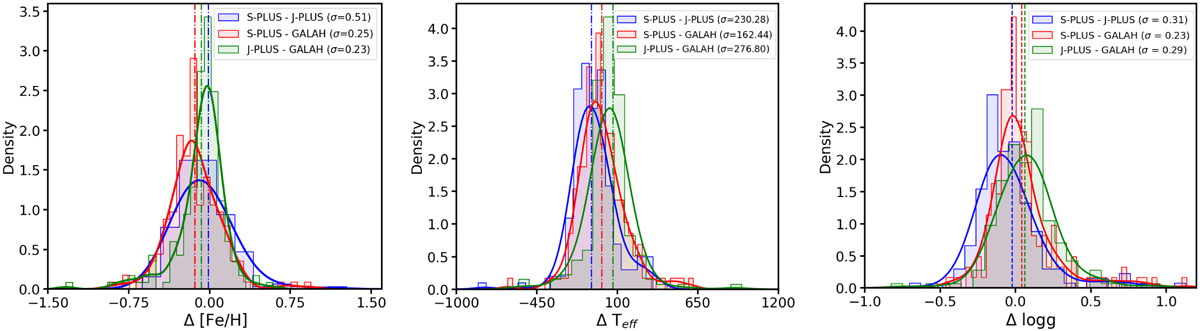
Comparison of the pairwise differences between the predicted values from the S-PLUS (this work), J-PLUS and spectroscopic values from GALAH for [Fe/H], Teff, and log g, for 186 dwarf stars. The dashed-dotted lines represent mean value of each distribution. The 1σ value of the difference of each pair of surveys are displayed in the legend.
Current usage metrics show cumulative count of Article Views (full-text article views including HTML views, PDF and ePub downloads, according to the available data) and Abstracts Views on Vision4Press platform.
Data correspond to usage on the plateform after 2015. The current usage metrics is available 48-96 hours after online publication and is updated daily on week days.
Initial download of the metrics may take a while.