Fig. 13
Download original image
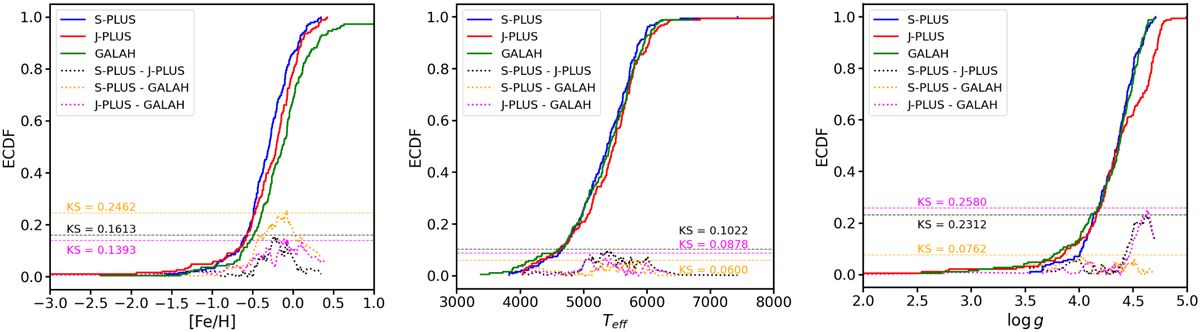
Empirical cumulative distribution functions (ECDFs) comparing predicted [Fe/H], Teff, and log g values from the S-PLUS (this work) with the predicted values of J-PLUS, and spectroscopic values from GALAH for 186 dwarf stars. The dotted lines represent the absolute differences between the ECDFs of the survey pairs, and the dashed horizontal lines indicate the Kolmogorov-Smirnov (KS) statistic for each pair of surveys, with lower KS values meaning closer agreement between the respective surveys.
Current usage metrics show cumulative count of Article Views (full-text article views including HTML views, PDF and ePub downloads, according to the available data) and Abstracts Views on Vision4Press platform.
Data correspond to usage on the plateform after 2015. The current usage metrics is available 48-96 hours after online publication and is updated daily on week days.
Initial download of the metrics may take a while.