Open Access
Fig. 12
Download original image
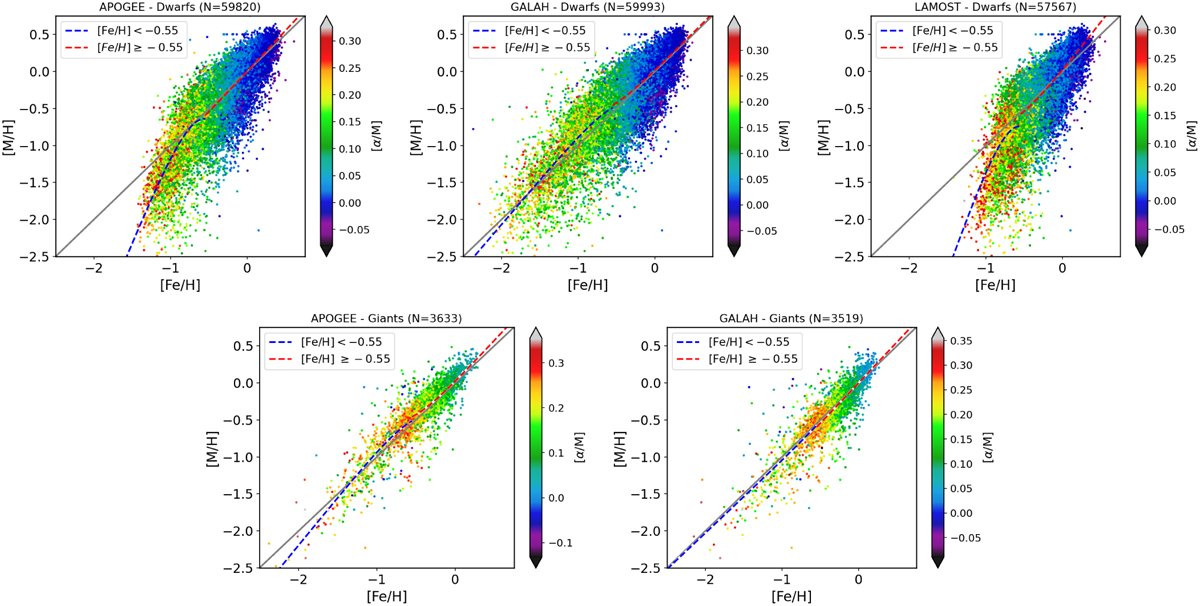
Comparison of [M/H] vs. [Fe/H] for dwarf stars (top panels) and giant stars (bottom panels). The color gradient represents [α/M], while the dashed and solid grey lines depict the linear fits and one-to-one relationship, respectively.
Current usage metrics show cumulative count of Article Views (full-text article views including HTML views, PDF and ePub downloads, according to the available data) and Abstracts Views on Vision4Press platform.
Data correspond to usage on the plateform after 2015. The current usage metrics is available 48-96 hours after online publication and is updated daily on week days.
Initial download of the metrics may take a while.