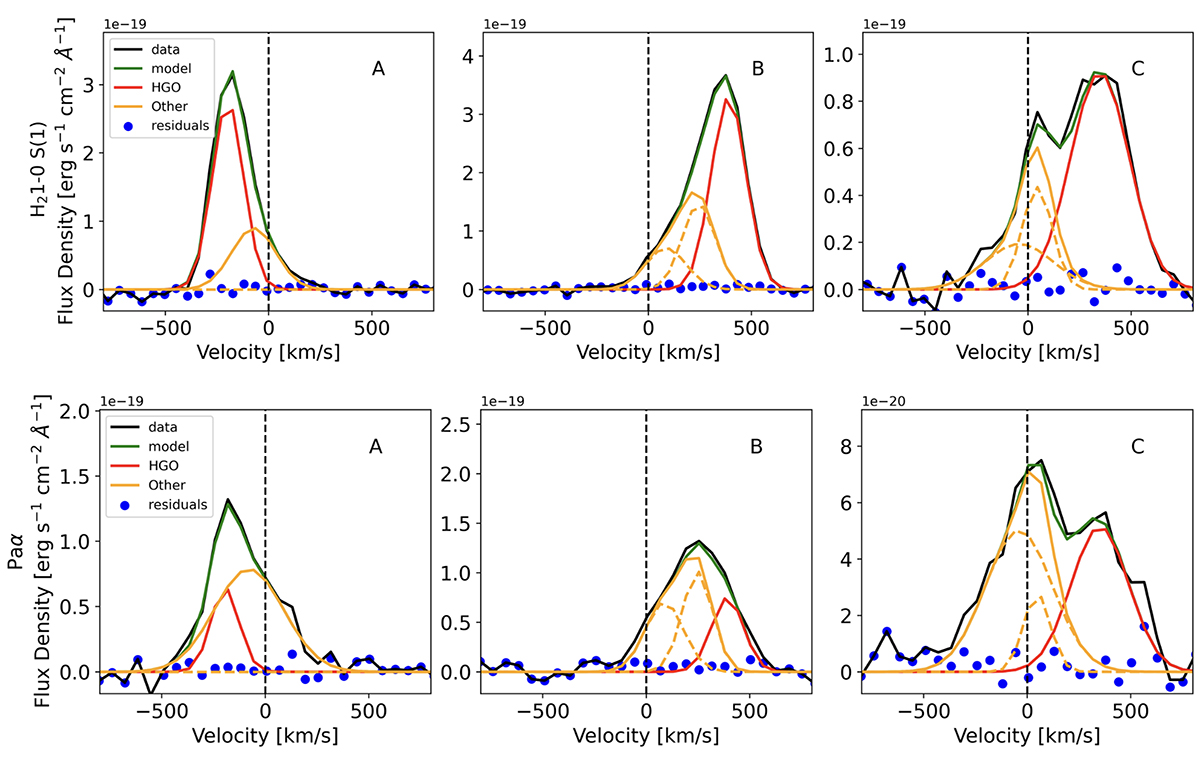
Fig. 9.
Download original image
Spectra extracted from the HG outflow region. The solid black curves represent the line profiles of H2 (top) and Paα (bottom) extracted from the spaxels marked in Fig. 8. The red curve refers to the HG outflow. Orange curves identify the additional components used for the fit (orange dashed curves). The combined model is displayed in green. The velocities are computed with respect to the systemic velocity of the W nucleus.
Current usage metrics show cumulative count of Article Views (full-text article views including HTML views, PDF and ePub downloads, according to the available data) and Abstracts Views on Vision4Press platform.
Data correspond to usage on the plateform after 2015. The current usage metrics is available 48-96 hours after online publication and is updated daily on week days.
Initial download of the metrics may take a while.