Fig. 6.
Download original image
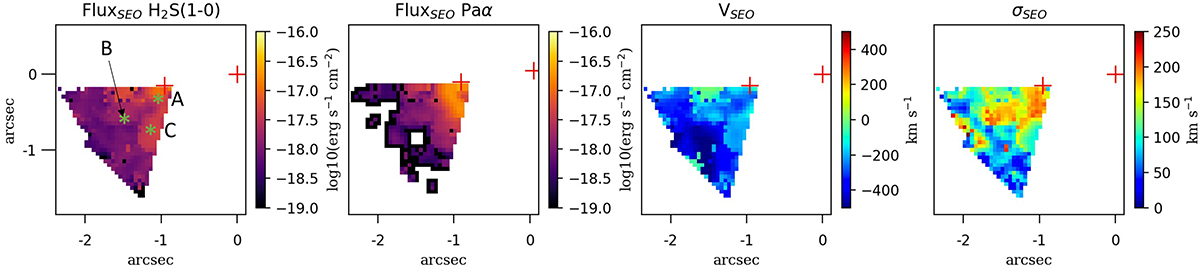
SE conical outflow flux and velocity maps. From left to right: flux of H2 and Paα lines, velocity, and velocity of the Gaussian component attributed to the SE outflow. The velocities are relative to the systemic velocity of the E nucleus. Red crosses indicate the positions of the two nuclei. Green asterisks in the first panel indicate the spaxels presented in Fig. 7.
Current usage metrics show cumulative count of Article Views (full-text article views including HTML views, PDF and ePub downloads, according to the available data) and Abstracts Views on Vision4Press platform.
Data correspond to usage on the plateform after 2015. The current usage metrics is available 48-96 hours after online publication and is updated daily on week days.
Initial download of the metrics may take a while.